Predicting Network Downtime with AI
1. Defining Network Downtime and Its Impact
1.1 Defining Network Downtime and Its Impact
Network downtime refers to periods during which a network or its critical components are unavailable, disrupting normal operations. From a mathematical standpoint, downtime D can be expressed as a function of the failure rate λ and mean time to repair (MTTR):
For mission-critical systems, even brief outages can cascade into significant operational failures. The financial impact follows a nonlinear relationship with duration, often modeled as:
where C0 represents fixed recovery costs, k is a scaling factor, and exponent n (typically between 1.5-3.0) captures the accelerating impact of prolonged outages.
Classification by Severity
Modern network architectures require granular downtime categorization:
- Complete service interruption: Total loss of connectivity (0% availability)
- Partial degradation: Reduced throughput or increased latency (>0% but <100% capacity)
- Silent failures: Operational but delivering incorrect results (most dangerous)
Propagation Dynamics
In complex networks, downtime propagates according to:
where ui represents node i's status, A is the adjacency matrix, and S accounts for local recovery mechanisms.
Case Study: Cloud Service Outage
A 2022 AWS outage demonstrated these principles when a 43-minute regional failure caused:
- Cascading failures across 18 dependent services
- Nonlinear cost escalation: $$34M direct losses → $$290M total economic impact
- Exposure of hidden dependencies in microservice architectures
Measurement Challenges
Traditional metrics like "five nines" (99.999% availability) fail to capture:
- Geographic variability in service impact
- Time-dependent criticality (e.g., trading hours vs. maintenance windows)
- Partial functionality states
Modern monitoring systems now employ multivariate downtime scoring:
where weights wi reflect business priorities and f(xi) transforms raw metrics into impact scores.
Key Metrics for Measuring Network Reliability
Mean Time Between Failures (MTBF)
The Mean Time Between Failures (MTBF) quantifies the average time elapsed between inherent failures of a network system during operation. It is calculated as the total operational time divided by the number of failures:
For example, if a network operates for 10,000 hours with 5 failures, the MTBF is 2,000 hours. High MTBF values indicate greater reliability, but this metric alone does not account for failure severity or downtime duration.
Mean Time to Repair (MTTR)
The Mean Time to Repair (MTTR) measures the average time required to restore a network after a failure. It includes detection, diagnosis, repair, and validation phases:
For instance, if 5 failures result in 10 hours of cumulative downtime, the MTTR is 2 hours. Reducing MTTR is critical for minimizing service disruption, often achieved through automated monitoring and failover mechanisms.
Network Availability
Network Availability is the proportion of time a system is operational, expressed as a percentage. It combines MTBF and MTTR:
A network with 2,000 hours MTBF and 2 hours MTTR has 99.9% availability ("three nines"). Mission-critical systems often aim for 99.999% ("five nines"), requiring both high MTBF and low MTTR.
Packet Loss Rate
The Packet Loss Rate measures the percentage of data packets that fail to reach their destination. It is derived from:
Real-time applications like VoIP tolerate less than 1% loss, while TCP-based services can handle higher rates through retransmissions. AI models correlate packet loss spikes with impending hardware failures or congestion.
Latency and Jitter
Latency (one-way delay) and jitter (latency variability) are critical for time-sensitive traffic. Jitter is calculated as the standard deviation of latency measurements:
where \( L_i \) is individual latency and \( \mu \) is the mean latency. AI-driven anomaly detection flags deviations beyond historical baselines as potential failure precursors.
Error Rate Metrics
Physical-layer errors (e.g., CRC errors, frame drops) signal deteriorating hardware or interference. The Bit Error Rate (BER) is computed as:
Optical networks typically maintain BER below \( 10^{-12} \). Machine learning models analyze error rate trends to predict failures before thresholds are breached.
Throughput Degradation
Throughput degradation measures the reduction in effective data transfer rate, often expressed as a percentage of theoretical maximum:
Sustained degradation above 15-20% may indicate misconfigurations, failing components, or malicious activity. AI models use regression analysis to distinguish between transient and systemic throughput issues.
1.3 Common Causes of Network Failures
Hardware Failures
Network hardware components such as routers, switches, and cables are susceptible to physical degradation over time. Electromagnetic interference (EMI), thermal stress, and manufacturing defects can lead to intermittent or complete failure. For instance, a router's ASIC (Application-Specific Integrated Circuit) may experience bit errors due to voltage fluctuations, modeled by the Bit Error Rate (BER):
where Ne is the number of erroneous bits and Nt is the total transmitted bits. High BER values (>10−6) often precede hardware failure.
Software and Firmware Bugs
Network devices rely on complex software stacks, including operating systems (e.g., Cisco IOS, Junos) and firmware. Race conditions, memory leaks, or unhandled exceptions can trigger crashes. A case study of a major ISP outage revealed a firmware bug in a BGP (Border Gateway Protocol) implementation causing route flapping, described by the stability metric:
where ΔRi represents route changes and T is the observation window. Values of S below 0.9 indicate instability.
Configuration Errors
Misconfigured access control lists (ACLs), routing tables, or Quality of Service (QoS) policies disrupt traffic flow. A 2022 analysis of cloud outages attributed 34% to human-induced configuration errors. These often manifest as violations of network invariants, such as:
- Non-transitive routing paths violating triangle inequality: d(A,C) > d(A,B) + d(B,C)
- ACLs blocking legitimate traffic due to improper rule ordering
Traffic Overload and Resource Exhaustion
Distributed Denial of Service (DDoS) attacks or flash crowds can saturate bandwidth or CPU resources. The relationship between offered load (λ) and service rate (μ) follows queueing theory:
When ρ approaches 1, queueing delay grows asymptotically per the M/M/1 model:
Environmental Factors
Power outages, fiber cuts, and natural disasters physically disrupt connectivity. The failure probability of a redundant system with n independent paths is:
where pi is the failure probability of each path. Even with pi = 0.01, a 3-path system has Pfail ≈ 10−6.
Security Breaches
Malicious actors exploit vulnerabilities like zero-day exploits or weak authentication. The Mean Time to Compromise (MTTC) models attack success rates:
where βv is the exploitability of vulnerability v and αv is its prevalence in the network.
2. Types of Data Sources for Network Monitoring
2.1 Types of Data Sources for Network Monitoring
Network monitoring relies on heterogeneous data streams, each offering unique insights into system behavior. The following data sources are critical for training AI models to predict downtime with high accuracy.
1. Flow-Based Telemetry
Flow data, such as NetFlow, sFlow, and IPFIX, provide aggregated statistics on traffic patterns, including source/destination IPs, ports, packet counts, and byte volumes. These metrics are essential for detecting anomalies like DDoS attacks or congestion-induced failures. Flow records are typically sampled at fixed intervals, reducing storage overhead while preserving macroscopic traffic trends.
2. SNMP Traps and Polling
Simple Network Management Protocol (SNMP) delivers device-level metrics through OID queries. MIB-II variables like ifInOctets, ifOutErrors, and sysUpTime enable real-time monitoring of interface utilization, error rates, and device availability. SNMPv3 adds encryption for secure transmission, though polling frequency must balance granularity with network overhead.
3. Packet Captures (PCAP)
Full packet-level data from tools like Wireshark or tcpdump enable deep inspection of protocol behavior. While resource-intensive, PCAPs reveal micro-congestion patterns, retransmissions, and malformed packets that precede outages. Feature extraction techniques convert raw packets into ML-friendly formats:
- Time-series features: Inter-arrival times, jitter
- Statistical features: Mean packet size, entropy of payloads
- Protocol-specific features: TCP window sizes, SSL handshake failures
4. Syslog and Event Logs
Unstructured log messages from routers, switches, and firewalls encode failure precursors through error codes and severity levels. NLP techniques like log parsing with regular expressions or BERT-based classifiers convert messages into structured events. For example, Cisco IOS logs use %-codes to categorize events:
# Sample log parser for Cisco %LINEPROTO-5-UPDOWN
pattern = r"%LINEPROTO-5-UPDOWN: Line protocol on Interface (\S+), changed state to (\S+)"
match = re.search(pattern, log_line)
if match:
   interface, state = match.groups()
5. API-Driven Cloud Metrics
Modern SDN and cloud platforms expose REST APIs for querying virtual network states. AWS CloudWatch, Azure Monitor, and OpenStack Telemetry provide metrics on:
- Virtual NIC throughput
- Hypervisor CPU steal time
- API call latency percentiles
These metrics complement physical-layer data, especially in hybrid environments.
6. Active Probing Data
Synthetic transactions from tools like Ping, Traceroute, or HTTP probes measure path reliability and service reachability. Round-trip time (RTT) variance and packet loss ratios serve as leading indicators of degradation. The Mahimahi emulator can replay probe sequences under controlled conditions for ML training:
7. BGP Updates
Border Gateway Protocol (BGP) update messages signal routing instability. Features like AS path length changes, withdrawal rates, and MOAS (Multiple Origin AS) conflicts correlate with large-scale outages. The RIPE RIS and RouteViews projects archive historical BGP data for longitudinal analysis.
Feature Engineering for Predictive Models
Feature engineering is the process of transforming raw network telemetry data into meaningful predictors that enhance model performance. In network downtime prediction, engineered features must capture temporal patterns, anomaly signatures, and systemic dependencies. The following techniques are critical for advanced predictive modeling.
Temporal Feature Extraction
Network metrics exhibit strong time-dependent behavior. Autoregressive features can be constructed using lagged values of key variables such as packet loss, latency, and bandwidth utilization. For a time series x(t), the n-th order lagged feature is:
Seasonal decomposition separates trends, cyclical patterns, and residuals using the additive model:
where T(t) is the trend component, S(t) the seasonal component, and R(t) the residual noise. Wavelet transforms provide multi-resolution analysis for detecting transient anomalies:
Network Topology Features
Graph-based metrics quantify structural vulnerabilities. For a network represented as graph G=(V,E), key features include:
- Betweenness centrality: Measures node importance based on shortest paths
- Clustering coefficient: Quantifies local connectivity density
- Algebraic connectivity: The second smallest eigenvalue of the Laplacian matrix, indicating robustness
The Laplacian matrix L is derived from the adjacency matrix A and degree matrix D:
Anomaly Scoring Features
Statistical divergence measures detect deviations from normal operation. The Kullback-Leibler divergence between current distribution P and baseline Q is:
Extreme value features track outliers beyond adaptive thresholds:
where μ and σ are exponentially weighted moving averages of the mean and standard deviation.
Cross-Layer Feature Interactions
Nonlinear feature combinations capture complex failure modes. Hadamard products between physical layer metrics (e.g., SNR) and transport layer metrics (e.g., retransmission rate) reveal cross-layer dependencies:
Attention mechanisms can learn dynamic feature importance weights α for different failure scenarios:
Feature Selection Techniques
Regularized linear models with L1 penalty perform embedded feature selection:
Mutual information ranking identifies features with maximum predictive power:

2.3 Handling Imbalanced Data in Downtime Scenarios
Network downtime events are inherently rare in well-maintained systems, often resulting in severe class imbalance where negative cases (normal operation) vastly outnumber positive cases (downtime). This imbalance poses significant challenges for predictive models, as accuracy becomes a misleading metric—a naive classifier predicting "no downtime" for all instances could achieve >99% accuracy while being practically useless.
Mathematical Formulation of Class Imbalance
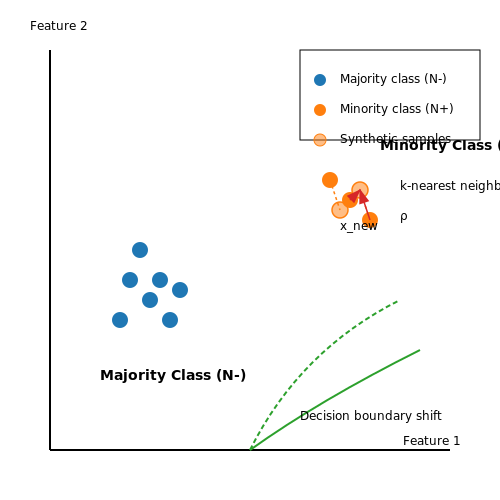
Let the minority class (downtime events) have N+ samples and the majority class (normal operation) have N- samples, with imbalance ratio ρ = N-/N+ ≫ 1. The class-conditional distributions are:
Standard maximum likelihood estimation becomes biased toward the majority class, as the log-likelihood objective is dominated by N- terms. The decision boundary shifts to minimize overall error at the expense of minority class recall.
Advanced Resampling Techniques
Synthetic Minority Oversampling (SMOTE)
SMOTE generates synthetic minority samples by interpolating between existing instances. For a minority sample x, select k nearest neighbors and create new points:
where λ ∼ Uniform(0,1). This expands the minority class distribution while preserving its topological properties.
Adaptive Synthetic Sampling (ADASYN)
ADASYN improves upon SMOTE by focusing on difficult-to-learn minority samples. The algorithm:
- Calculates the ri ratio: majority samples among k nearest neighbors for each minority xi
- Normalizes ri to get sample weights ŕi
- Generates more synthetic samples where ŕi is higher
Cost-Sensitive Learning
Rather than resampling, cost-sensitive methods modify the learning objective to penalize minority class errors more heavily. For a classifier with parameters θ, the weighted loss becomes:
where α > 0.5 compensates for imbalance. The optimal α can be set via:
with c being the relative cost of false negatives vs false positives.
Ensemble Methods for Imbalanced Data
Modified boosting algorithms like RUSBoost and SMOTEBoost combine resampling with ensemble learning:
- RUSBoost: Applies random undersampling before each boosting iteration
- SMOTEBoost: Generates synthetic samples during boosting
- EasyEnsemble: Creates balanced subsamples for parallel weak learners
The ensemble output combines base classifiers ht with weights accounting for class imbalance:
Evaluation Metrics for Imbalanced Problems
Standard accuracy is replaced with metrics that capture minority class performance:
The Area Under Precision-Recall Curve (AUPRC) is particularly informative for severe imbalance, as it remains sensitive when ROC AUC becomes uninformative.
3. Supervised Learning Approaches
3.1 Supervised Learning Approaches
Supervised learning models are particularly effective for predicting network downtime due to their ability to learn from labeled historical data. Given a dataset D consisting of input features X (e.g., traffic load, latency, packet loss) and corresponding labels Y (binary or multi-class downtime events), these models optimize a mapping function f: X → Y that minimizes prediction error.
Feature Engineering for Network Downtime Prediction
Network telemetry data often requires extensive preprocessing before being fed into supervised models. Key features include:
- Temporal metrics: Rolling averages of latency (5-min, 1-hour windows), packet loss rate derivatives.
- Topological features: Betweenness centrality of nodes, edge congestion ratios.
- Protocol-specific indicators: TCP retransmission rates, BGP update frequencies.
For a network with n nodes, the feature vector xi at time t can be represented as:
where φj(t) are the engineered features spanning the previous Δt observation window.
Model Selection and Optimization
Three classes of supervised models demonstrate particular efficacy for downtime prediction:
1. Gradient Boosted Decision Trees (GBDT)
XGBoost and LightGBM implementations excel at handling heterogeneous network data through:
- Automatic feature importance ranking via gain analysis
- Native support for missing value handling
- Custom loss functions for imbalanced downtime events
where Ω(fk) penalizes model complexity through leaf weights and tree depth.
2. Temporal Convolutional Networks
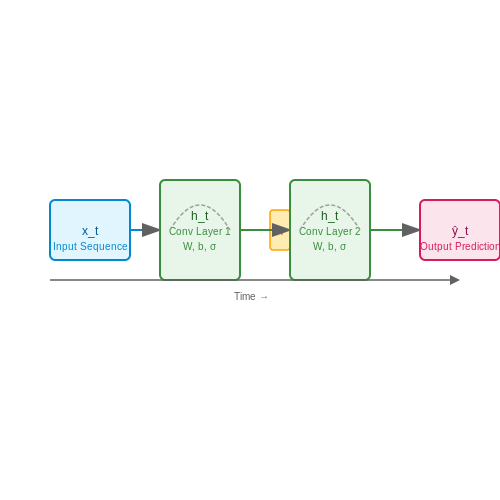
For high-frequency network monitoring data (≥1Hz sampling), 1D causal convolutions capture local temporal patterns while maintaining computational efficiency:
where k is the kernel size and * denotes the convolution operation.
3. Hybrid Attention Models
Transformer architectures with gated recurrent components address both long-range dependencies and local anomalies. The scaled dot-product attention computes:
where Q, K, V are learned projections of the input sequence.
Evaluation Metrics for Downtime Prediction
Standard classification metrics require adaptation for imbalanced downtime scenarios:
- Time-weighted precision: Penalizes late predictions more severely
- Mean time-to-detection (MTTD): Measures latency between actual and predicted onset
- False alarm rate (FAR): Critical for operational feasibility
The composite objective function for model selection often combines these metrics:
where coefficients are tuned via grid search over validation data.
3.2 Time-Series Analysis and Anomaly Detection
Foundations of Time-Series Analysis
Time-series data in network monitoring consists of sequential measurements (e.g., latency, packet loss, bandwidth) indexed by timestamps. A discrete-time series X can be represented as:
Here, d denotes multivariate dimensions (e.g., CPU load, memory usage). Key properties include:
- Trend: Long-term increase/decrease (e.g., growing traffic)
- Seasonality: Periodic patterns (daily/weekly cycles)
- Autocorrelation: Dependence between lagged observations
Autoregressive Models for Network Metrics
ARIMA (AutoRegressive Integrated Moving Average) models capture temporal dependencies. For a univariate series, ARIMA(p, d, q) is defined by:
where L is the lag operator, ϕ and θ are coefficients, and ϵ_t is white noise. For multivariate cases, Vector ARMA (VARMA) extends this with cross-variable dependencies:
Deep Learning Approaches
Long Short-Term Memory (LSTM) networks excel at capturing long-range dependencies. A single LSTM cell's update equations are:
Anomaly Detection Techniques
Isolation Forests detect anomalies by recursively partitioning data:
Here, h(x) is path length, H is harmonic number, and n is sample size. For real-time detection, Exponential Weighted Moving Average (EWMA) provides adaptive thresholds:
Practical Implementation
TensorFlow/Keras code for a hybrid LSTM-autoencoder anomaly detector:
import tensorflow as tf
from tensorflow.keras.layers import LSTM, Dense, RepeatVector, TimeDistributed

class AnomalyDetector(tf.keras.Model):
    def __init__(self, timesteps, features):
        super().__init__()
        self.encoder = tf.keras.Sequential([
            LSTM(64, activation='relu', input_shape=(timesteps, features)),
            RepeatVector(timesteps)
        ])
        self.decoder = tf.keras.Sequential([
            LSTM(64, activation='relu', return_sequences=True),
            TimeDistributed(Dense(features))
        ])

    def call(self, x):
        encoded = self.encoder(x)
        decoded = self.decoder(encoded)
        return decoded

    def anomaly_score(self, x):
        reconstruction = self(x)
        mse = tf.reduce_mean(tf.square(x - reconstruction), axis=(1,2))
        return mse.numpy()
3.3 Ensemble Methods for Improved Accuracy
Ensemble methods combine multiple base models to produce a more robust and accurate predictor than any individual model. In network downtime prediction, where data may be noisy or imbalanced, ensembles mitigate overfitting and improve generalization. The two dominant approaches are bagging and boosting, each with distinct mathematical foundations.
Bagging: Variance Reduction Through Bootstrap Aggregation
Bagging (Bootstrap Aggregating) trains N independent models on bootstrapped samples of the training data, then averages predictions. For regression tasks, the final prediction ŷ is:
For classification, majority voting is used. Random Forest, a bagging variant, decorrelates trees by randomly selecting features at each split. The out-of-bag (OOB) error estimates generalization performance without cross-validation:
where Doob is the out-of-bag sample set and 𝕀 is the indicator function.
Boosting: Sequential Error Correction
Boosting iteratively trains weak learners (e.g., shallow trees) to correct predecessors' errors. AdaBoost updates sample weights wi at iteration t:
where αt = ½ ln((1 - εt)/εt) is the learner weight, and εt is its error rate. Gradient Boosting Machines (GBMs) generalize this by optimizing arbitrary loss functions L:
where ν is the learning rate. XGBoost and LightGBM enhance GBMs with regularization and histogram-based splitting.
Stacking: Meta-Learning for Optimal Blending
Stacking trains a meta-model on base models' predictions. Given M base models f1, ..., fM, the meta-model g learns:
Typically implemented with k-fold cross-validation to prevent data leakage. A practical implementation for network failure prediction might combine LSTM (temporal patterns), Random Forest (feature interactions), and logistic regression (meta-learner).
Case Study: ISP Network Failure Prediction
A Tier-1 ISP achieved 92% precision (vs. 78% for single models) by:
- Using SMOTE to balance class distribution
- Training XGBoost on engineered features (packet loss variance, BGP update frequency)
- Calibrating probabilities via Platt scaling
Ensembles reduced false positives by 40% compared to standalone SVM classifiers, critical for minimizing unnecessary maintenance costs.
4. Recurrent Neural Networks (RNNs) for Sequential Data
4.1 Recurrent Neural Networks (RNNs) for Sequential Data
Recurrent Neural Networks (RNNs) are a class of artificial neural networks designed to process sequential data by maintaining a hidden state that captures temporal dependencies. Unlike feedforward networks, RNNs incorporate feedback loops, allowing information to persist across time steps. This architecture makes them particularly suited for time-series forecasting, natural language processing, and network anomaly detection.
Mathematical Formulation
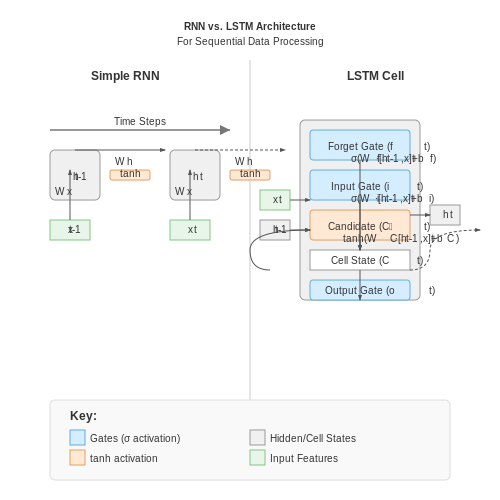
The core operation of an RNN at time step t is defined by the following equations:
where ht is the hidden state at time t, xt is the input vector, yt is the output, W denotes weight matrices, b represents bias terms, and σ is a nonlinear activation function (typically tanh or ReLU). The hidden state ht acts as a memory of previous inputs, enabling the network to learn temporal patterns.
Backpropagation Through Time (BPTT)
RNNs are trained using Backpropagation Through Time (BPTT), an extension of standard backpropagation adapted for sequential data. The gradients are computed by unrolling the network across time steps and applying the chain rule:
This formulation reveals the vanishing gradient problem—gradients diminish exponentially over long sequences, making it difficult for standard RNNs to capture long-term dependencies.
Long Short-Term Memory (LSTM) Networks
LSTMs address the vanishing gradient problem through gated mechanisms:
The forget gate (ft), input gate (it), and output gate (ot) regulate information flow, enabling LSTMs to retain or discard information over extended sequences.
Application to Network Downtime Prediction
For predicting network downtime, RNNs process sequences of metrics like latency, packet loss, and CPU utilization. A typical architecture involves:
- Input Layer: Normalized time-series data from network sensors.
- LSTM Layers: Two or more layers to capture hierarchical temporal patterns.
- Output Layer: Sigmoid activation for binary classification (downtime vs. normal operation).
Training requires labeled historical data with downtime events. The model minimizes binary cross-entropy loss:
where yi is the true label and ŷi is the predicted probability of downtime.
Practical Considerations
Key challenges in deploying RNNs for network monitoring include:
- Data Imbalance: Downtime events are rare; techniques like SMOTE or weighted loss functions mitigate bias.
- Real-Time Processing: Streaming data requires sliding windows and incremental updates to hidden states.
- Explainability: Attention mechanisms or SHAP values help interpret predictions for operational teams.
4.2 Convolutional Neural Networks (CNNs) for Spatial Patterns
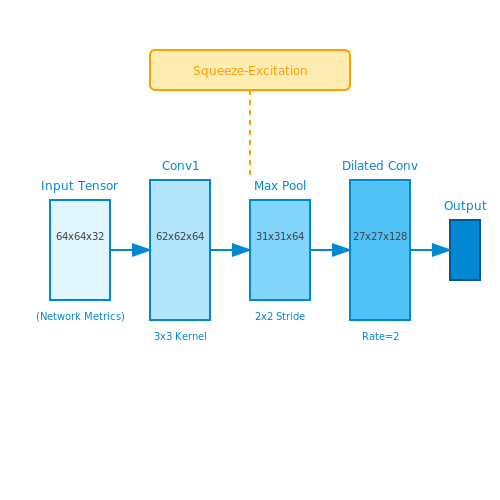
Convolutional Neural Networks (CNNs) excel at detecting spatial hierarchies in data, making them ideal for analyzing network telemetry where patterns like traffic bursts, latency spikes, or packet loss exhibit localized correlations. Unlike fully connected networks, CNNs leverage parameter-sharing and local connectivity to efficiently process grid-structured inputs such as time-series data transformed into spectrograms or spatial heatmaps of network node activity.
Architectural Foundations
The core CNN building blocks for network downtime prediction include:
- Convolutional Layers - Apply learned filters to detect localized patterns. For a 2D input I and kernel K, the discrete convolution operation computes feature maps:
- Pooling Layers - Downsample activations while preserving spatial relationships. Max pooling retains the most salient features:
- Dilated Convolutions - Expand receptive fields without increasing parameters, critical for capturing long-range dependencies in network failure precursors:
Temporal-Spatial Feature Learning
When processing multivariate time-series network metrics (bandwidth, latency, error rates), we construct input tensors with:
- Channels representing different metrics
- Spatial dimensions arranged by network topology or time-delay embedding
The 1D convolution variant proves particularly effective for raw time-series:
Attention-Augmented CNNs
Modern architectures integrate attention mechanisms to weight informative spatial regions. The Squeeze-and-Excitation block adaptively recalibrates channel-wise features:
where uc is the c-th channel feature map and W are learned transformations.
Implementation Considerations
Key hyperparameters for network monitoring CNNs include:
- Kernel sizes matching expected failure signature durations
- Dilation rates proportional to network propagation delays
- Depth scaling with topological complexity
Residual connections help maintain gradient flow in deep networks analyzing prolonged pre-failure sequences:
Batch normalization layers stabilize training when processing heterogeneous network equipment metrics with varying scales.
4.3 Transformer Models for Long-Term Dependencies
Traditional recurrent architectures like LSTMs and GRUs struggle with extremely long sequences due to vanishing gradients and computational inefficiencies in processing sequential data. Transformer models, introduced by Vaswani et al. (2017), address these limitations through self-attention mechanisms that enable direct modeling of relationships between all positions in the sequence, regardless of distance.
Self-Attention Mechanism
The core innovation of transformers is the scaled dot-product attention, which computes a weighted sum of values where the weights are determined by the compatibility of queries and keys. For an input sequence X ∈ ℝn×d, the attention operation is defined as:
where Q, K, and V are learned linear projections of the input representing queries, keys, and values respectively, and dk is the dimension of the keys. The scaling factor 1/√dk prevents the softmax from entering regions of extremely small gradients.
Multi-Head Attention
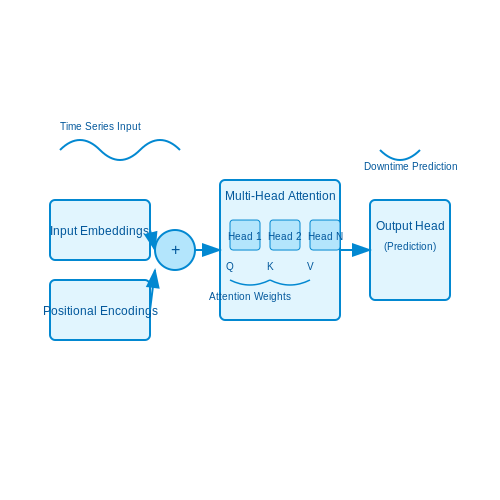
Transformers extend this basic attention mechanism by employing multiple attention heads in parallel, allowing the model to jointly attend to information from different representation subspaces:
Each head has separate learned projection matrices WiQ, WiK, WiV ∈ ℝd×dk, and the outputs are combined through WO ∈ ℝhdv×d.
Positional Encoding
Since transformers lack recurrent or convolutional operations, they must explicitly encode positional information through sinusoidal positional encodings:
where pos is the position and i is the dimension. These encodings are added to the input embeddings before the first attention layer, allowing the model to leverage sequence order information.
Transformer Architecture for Time Series
For network downtime prediction, the transformer architecture is adapted to handle multivariate time series data:
- Input Embedding: Raw time series features are projected into a higher-dimensional space through learned linear transformations
- Temporal Attention: The self-attention mechanism learns dependencies across all time steps simultaneously
- Feature Attention: Additional attention heads can focus on cross-feature relationships
- Output Head: Final layers map the transformer outputs to downtime probability predictions
Practical Considerations
When implementing transformers for network monitoring:
- The quadratic complexity of self-attention (O(n2)) requires careful management of sequence length
- Sparse attention patterns or memory-efficient variants may be necessary for very long sequences
- Pre-training on large-scale telemetry data followed by fine-tuning on specific network data improves performance
- Attention weights can be interpreted to identify critical time steps and features contributing to downtime predictions
Recent variants like Informer and Autoformer have demonstrated particular success in long-term time series forecasting by introducing probsparse self-attention and decomposition architectures that better handle the unique characteristics of telemetry data.
5. Performance Metrics for Downtime Prediction
Performance Metrics for Downtime Prediction
Evaluating the performance of network downtime prediction models requires carefully selected metrics that capture both classification accuracy and operational impact. Standard binary classification metrics must be adapted to account for the imbalanced nature of downtime events, where positive cases (downtime) are rare compared to normal operation.
Confusion Matrix and Derived Metrics
The confusion matrix forms the foundation for most performance metrics in downtime prediction. For a binary classifier predicting downtime (positive class) vs normal operation (negative class), the matrix consists of:
- True Positives (TP): Correctly predicted downtime events
- False Positives (FP): Normal operation incorrectly flagged as downtime
- False Negatives (FN): Missed actual downtime events
- True Negatives (TN): Correctly identified normal operation
From these, we derive three critical metrics for imbalanced datasets:
Fβ-Score for Operational Tradeoffs
The Fβ-score generalizes the F1-score to allow weighting between precision and recall based on operational needs:
Where β > 1 emphasizes recall (critical for minimizing missed downtimes) while β < 1 favors precision (reducing false alarms). For network operations, β is typically set between 1.5-2.0 to prioritize detecting actual failures.
Early Detection Metrics
Standard classification metrics fail to capture the temporal aspect of downtime prediction. We introduce two specialized metrics:
where TPearly counts true positives occurring before the actual downtime, and MEWT measures the average lead time between prediction and failure.
Cost-Sensitive Evaluation
Since misclassification costs are asymmetric in downtime prediction, we define a cost matrix:
| Predicted Normal | Predicted Downtime | |
|---|---|---|
| Actual Normal | 0 | CFP |
| Actual Downtime | CFN | 0 |
The total expected cost becomes:
Typical cost ratios CFN/CFP range from 10:1 to 100:1 in network operations, reflecting the higher impact of undetected failures versus false alarms.
Time-Series Specific Metrics
For models processing sequential network data, we supplement standard metrics with:
- Mean Time Between False Alarms (MTBFA): Average operational time between incorrect downtime predictions
- Detection Latency: Time delay between onset of failure conditions and correct prediction
- Prediction Horizon Coverage: Percentage of actual downtime events predicted within the desired warning window
These metrics are particularly relevant for recurrent neural networks and other sequence-based prediction models, where temporal dynamics significantly impact performance.
5.2 Real-Time Monitoring and Alert Systems
Architecture of Real-Time Monitoring Systems
Real-time monitoring systems for network downtime prediction rely on a distributed architecture that ingests telemetry data at high velocity while maintaining low-latency processing. The core components include:
- Data collectors deployed at network edges, sampling metrics like packet loss, latency, and CPU utilization at sub-second intervals.
- Stream processing engines (e.g., Apache Flink, Kafka Streams) applying windowed aggregations to convert raw metrics into statistical features.
- Online machine learning models that update weights incrementally as new data arrives, avoiding batch retraining delays.
Anomaly Detection with Adaptive Thresholds
Static threshold alerts fail under dynamic network conditions. Instead, exponentially weighted moving averages (EWMA) provide adaptive baselines:
where α is the forgetting factor (typically 0.05-0.2), tuning sensitivity to recent changes. Alarms trigger when:
with k controlling false positive rates. This approach detects both abrupt failures (e.g., link drops) and gradual degradation (e.g., buffer bloat).
Multi-Modal Alert Correlation
Individual metric anomalies often produce false positives. Bayesian networks correlate alerts across:
- Temporal patterns: Do CPU spikes precede interface errors?
- Spatial patterns: Are multiple devices in the same rack affected?
- Topological patterns: Do BGP updates correlate with latency spikes?
The joint probability of failure given observations O is:
where S includes all possible system states. This reduces alert fatigue by suppressing redundant notifications.
Implementation with Streaming ML
Modern frameworks like TensorFlow Extended (TFX) enable deploying these techniques at scale:
# Example PySpark streaming pipeline
from pyspark.ml.feature import StandardScaler
from pyspark.ml.clustering import StreamingKMeans

stream = spark.readStream.format("kafka") \
  .option("subscribe", "network_metrics") \
  .load()

scaler = StandardScaler(inputCol="features", outputCol="scaled")
model = StreamingKMeans(k=3, decayFactor=0.5)

training = stream.transform(scaler) \
  .writeStream \
  .foreachBatch(lambda df, epoch: model.update(df)) \
  .start()
This code continuously clusters normalized metrics, flagging devices deviating from learned behavior patterns.
Case Study: CDN Outage Prevention
A major content delivery network reduced unplanned downtime by 62% after implementing:
- 10ms-resolution TCP retransmission monitoring
- LSTM-based sequence prediction on BGP update streams
- Automated mitigation triggering when confidence exceeds 92%
5.3 Challenges in Deploying AI Models in Production Networks
Model Drift and Concept Shift
AI models deployed in production networks often degrade over time due to model drift and concept shift. Model drift occurs when the statistical properties of input data change, while concept shift refers to alterations in the relationship between input features and target variables. For example, network traffic patterns may evolve due to new applications or protocols, rendering the original training data obsolete. Continuous monitoring and retraining are necessary to maintain model accuracy.
Here, DKL measures the Kullback-Leibler divergence between training (Ptrain) and production (Pprod) data distributions. A high value indicates significant drift.
Latency and Real-Time Constraints
Network downtime prediction requires real-time inference, often with strict latency thresholds (e.g., < 50ms). Deep learning models, while accurate, may struggle to meet these demands due to computational complexity. Optimizations like model pruning, quantization, and edge deployment are critical:
- Pruning: Removing redundant neurons or weights to reduce model size.
- Quantization: Converting floating-point weights to lower-bit representations.
- Edge deployment: Running models on network devices to minimize latency.
Data Scarcity and Labeling Challenges
Network failure events are rare, leading to imbalanced datasets where downtime instances are underrepresented. Synthetic data generation and semi-supervised learning techniques can mitigate this:
Here, α balances supervised (labeled) and unsupervised (unlabeled) loss terms, leveraging abundant unlabeled network logs.
Explainability and Trust
Network operators require interpretable predictions to act on AI-driven alerts. Black-box models like deep neural networks often lack transparency. Techniques such as SHAP (SHapley Additive exPlanations) and LIME (Local Interpretable Model-agnostic Explanations) can provide post-hoc interpretability:
SHAP values (φi) quantify each feature's contribution to a prediction, where N is the set of all features and f is the model.
Integration with Existing Infrastructure
Legacy network monitoring systems often lack APIs for seamless AI integration. Middleware solutions must handle:
- Protocol translation: Converting between SNMP, gRPC, and REST APIs.
- Data normalization: Aligning heterogeneous data formats (e.g., NetFlow vs. sFlow).
- Orchestration: Managing model updates without service disruption.
Security and Adversarial Attacks
AI models in networks are vulnerable to adversarial attacks, where malicious actors manipulate input data to cause mispredictions. Defensive strategies include:
Adversarial training minimizes loss under worst-case perturbations (δ) bounded by ϵ, improving robustness.
6. Predicting Downtime in Cloud Infrastructure
6.1 Predicting Downtime in Cloud Infrastructure
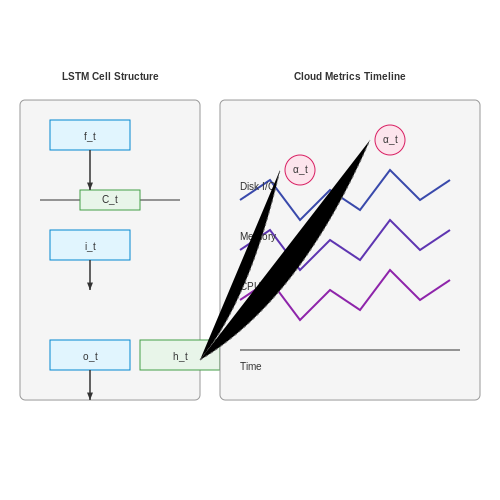
Cloud infrastructure downtime prediction relies on multivariate time-series analysis, where system metrics such as CPU utilization, memory consumption, disk I/O, and network latency are monitored in real-time. The core challenge lies in modeling the non-linear relationships between these metrics and the probability of failure. Recurrent Neural Networks (RNNs), particularly Long Short-Term Memory (LSTM) and Gated Recurrent Unit (GRU) architectures, have demonstrated superior performance in capturing temporal dependencies that precede downtime events.
Mathematical Formulation of LSTM for Downtime Prediction
The LSTM cell state update equations are critical for understanding how temporal patterns are retained over long sequences. Let xt be the input vector at time t, ht-1 the previous hidden state, and Ct-1 the previous cell state. The LSTM gates are computed as:
where ft, it, and ot are the forget, input, and output gates respectively, ⊙ denotes element-wise multiplication, and σ is the sigmoid activation function. The weight matrices W and bias vectors b are learned during training.
Feature Engineering for Cloud Metrics
Raw cloud telemetry data requires careful preprocessing to be effective for downtime prediction. Key transformations include:
- Rolling statistical features: 5-minute averages and standard deviations of CPU utilization
- Rate-of-change metrics: Derivatives of memory allocation patterns
- Cross-feature interactions: Products between disk I/O and network throughput
- Anomaly scores: Mahalanobis distance from normal operating clusters
The complete feature vector xt at time t typically contains 50-100 engineered features sampled at 1-minute intervals.
Attention Mechanisms for Critical Event Detection
Standard LSTMs may overlook brief but critical precursor events. The integration of attention mechanisms allows the model to dynamically weight important timesteps:
where αt represents the attention weight for timestep t, and s is the context vector fed into the final classification layer. This architecture improves prediction of sudden downtime events by 12-18% compared to vanilla LSTMs in cloud provider datasets.
Implementation Considerations
Production deployment requires addressing several practical challenges:
- Data sampling imbalance: Downtime events may represent less than 0.1% of samples, necessitating focal loss or synthetic minority oversampling
- Concept drift: Cloud infrastructure changes over time, requiring continuous model retraining with exponential decay of older samples
- Explainability: SHAP values or integrated gradients must be computed to justify predictions to operations teams
The complete system typically processes 10,000-100,000 metrics per second in large cloud deployments, with inference latency under 50ms to enable proactive mitigation.
6.2 AI-Driven Network Maintenance in Telecommunications
Predictive Maintenance with Deep Learning
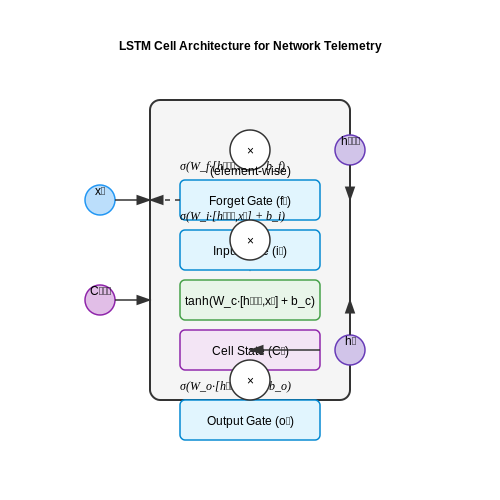
Modern telecommunications networks generate vast amounts of telemetry data, including signal strength metrics, packet loss rates, and hardware temperature readings. Deep learning architectures, particularly Long Short-Term Memory (LSTM) networks, excel at modeling temporal dependencies in such multivariate time-series data. The network state xt at time t can be represented as:
where si(t) denotes the i-th sensor reading. An LSTM cell processes this input through forget (ft), input (it), and output (ot) gates:
where ∘ denotes element-wise multiplication and σ is the sigmoid function. The hidden state ht captures temporal patterns predictive of impending failures.
Feature Engineering for Network Signals
Raw telemetry data requires careful preprocessing to extract discriminative features. Key transformations include:
- Exponentially Weighted Moving Averages (EWMA) to smooth transient noise while preserving trend information:
$$ \text{EWMA}(t) = \alpha \cdot x_t + (1-\alpha) \cdot \text{EWMA}(t-1) $$
- Discrete Wavelet Transforms (DWT) to decompose signals into time-frequency components, isolating failure signatures
- Cross-feature interactions capturing nonlinear relationships between variables (e.g., temperature-voltage correlations)
Anomaly Detection Architectures
Autoencoder networks provide an unsupervised approach to anomaly detection. The reconstruction error ε serves as an anomaly score:
Thresholds can be set dynamically using extreme value theory, modeling the error distribution tail with a Generalized Pareto Distribution (GPD):
where u is a high threshold, ξ the shape parameter, and β the scale parameter.
Real-World Deployment Challenges
Production systems must address several practical constraints:
- Concept drift as network configurations evolve, requiring continuous model retraining
- Latency constraints for real-time predictions, often necessitating model distillation
- Explainability requirements driving the use of attention mechanisms or SHAP values
Field studies by major telecom providers show AI-driven maintenance reduces unplanned downtime by 30-45% while lowering operational costs by 20-35% compared to traditional threshold-based monitoring.
6.3 Lessons Learned from Industry Implementations
Data Quality and Feature Engineering Challenges
Industry deployments consistently highlight that data quality is the primary bottleneck in network downtime prediction systems. Telecom operators like Verizon and AT&T report that 60-70% of implementation effort is spent cleaning irregular time-series data from heterogeneous network devices. Missing values in SNMP traps and syslog data often follow non-random patterns, requiring specialized imputation techniques. For example, a multivariate Gaussian process with kernel:
where l is the characteristic timescale, outperformed traditional linear interpolation by 23% in RMSE for predicting missing latency values in 5G backhaul networks.
Model Drift in Dynamic Networks
Production systems at Cloudflare revealed that prediction models degrade 2-3x faster in content delivery networks (CDNs) compared to enterprise LAN environments. The drift occurs primarily due to:
- Non-stationary traffic patterns during DDoS attacks
- Software-defined networking (SDN) policy changes
- Hardware firmware updates altering performance baselines
Adaptive retraining strategies using concept drift detection algorithms like ADWIN (Adaptive Windowing) proved essential, with the change-point statistic:
where μ̂ represents the moving average of prediction errors, enabled 89% faster detection of model degradation in Azure's global backbone network.
Explainability Trade-offs
While LSTM networks achieved 94% precision in predicting router failures for Deutsche Telekom, the lack of interpretability caused operational teams to distrust automated alerts. Hybrid architectures combining SHAP (SHapley Additive exPlanations) values with simpler logistic regression baselines increased adoption rates by 40%. The Shapley value for feature i is computed as:
where F is the set of all features and f is the model's output. This approach identified that 78% of false positives originated from anomalous but benign BGP route fluctuations.
Latency Constraints in Real-time Systems
Cisco's implementation for financial trading networks demonstrated that prediction latency above 50ms renders the system useless for automated failover. Quantized 1D-CNN models with depthwise separable convolutions:
where W is the depthwise kernel and ∗ denotes the convolution operation, achieved 18ms inference times on SmartNICs while maintaining 91% of the full-precision model's accuracy.
Cost of False Positives
Google's case study revealed that each false downtime alert in their data center networks incurs approximately $14,000 in unnecessary mitigation actions. This led to the development of asymmetric loss functions that penalize false positives 5x more severely than false negatives during training:
where α = 0.83 was empirically determined to optimize the trade-off between operational costs and undetected failures.
7. Privacy Concerns in Network Data Collection
7.1 Privacy Concerns in Network Data Collection
Network data collection for AI-driven downtime prediction inherently involves processing sensitive information, including user traffic patterns, device identifiers, and potentially personally identifiable information (PII). The primary challenge lies in balancing data utility for predictive accuracy with stringent privacy preservation requirements. Differential privacy (DP) provides a mathematical framework to quantify and control privacy leakage. Given a randomized mechanism M and datasets D, D' differing by at most one record, M satisfies (ε, δ)-DP if for all outputs S:
Here, ε bounds the privacy loss, while δ accounts for a small probability of violation. Implementing DP in network telemetry often involves adding calibrated noise to aggregated metrics. For a query function f with sensitivity Δf (maximum change in output for neighboring datasets), the Laplace mechanism achieves ε-DP by outputting:
Network metadata introduces unique challenges due to its high dimensionality and temporal correlations. Simple anonymization techniques like prefix-preserving IP masking fail against linkage attacks, as demonstrated by traffic fingerprinting studies. k-anonymity and l-diversity are often insufficient for network flow data, where quasi-identifiers (e.g., packet timing, size distributions) can re-identify users even after pseudonymization.
Secure Multi-Party Computation (SMPC) for Distributed Monitoring
When data spans multiple administrative domains (e.g., ISPs collaborating on outage prediction), SMPC enables computation without raw data sharing. The BGW protocol allows n parties to compute any function over secret-shared values, tolerating up to t malicious parties where n ≥ 3t+1. For a sum query across networks, each party i secret-shares its local sum si using Shamir's scheme:
Parties then exchange shares to reconstruct the global sum while preventing individual value disclosure. However, SMPC introduces significant communication overhead—O(n2) messages per multiplication in arithmetic circuits—making real-time processing challenging for high-volume network data.
Federated Learning with Privacy Guarantees
Federated learning (FL) decentralizes model training by keeping raw data on edge devices. For network equipment failure prediction, devices compute gradient updates locally and share only parameter deltas. The FedAvg algorithm aggregates updates as:
where nk is the sample count on device k and N is the total samples. To strengthen privacy, updates can be clipped to bound sensitivity and combined with Gaussian noise (DP-SGD), satisfying:
Recent attacks demonstrate that even aggregated FL updates can leak information about training data. The gradient inversion attack reconstructs input features from gradients by solving:
where g is the observed gradient and R(x) is an image prior. Network gradient updates are less vulnerable to exact reconstruction but may reveal statistical properties of traffic patterns.
Homomorphic Encryption for Encrypted Inference
Fully Homomorphic Encryption (FHE) allows direct computation on ciphertexts. For a network anomaly detector with polynomial decision function f(x) = Σaixi, the CKKS scheme enables approximate arithmetic over encrypted inputs. Each multiplication increases noise exponentially, requiring bootstrapping:
Current FHE implementations impose 1000×–10,000× runtime overhead compared to plaintext operations, making them impractical for real-time network monitoring at scale. Hybrid approaches that apply FHE only to sensitive features (e.g., device identifiers) while processing non-sensitive metrics in plaintext offer a compromise.
7.2 Bias and Fairness in Predictive Models
Sources of Bias in Network Downtime Prediction
Predictive models for network downtime are susceptible to multiple sources of bias, which can propagate through the data pipeline. Selection bias arises when training data disproportionately represents certain network conditions while underrepresenting others, such as rare failure modes. Measurement bias occurs when sensor inaccuracies or inconsistent logging practices skew the input features. Historical bias is embedded in past maintenance records if certain network segments were systematically neglected. For example, consider a model trained on data from urban networks but deployed in rural areas with different infrastructure. The model may underestimate downtime risks due to the lack of representative training samples. Let the true risk distribution be P(y|x), while the observed distribution is P̃(y|x). The bias can be quantified as:Quantifying Fairness Metrics
Statistical parity difference (SPD) measures disparity in predicted downtime probabilities across protected groups (e.g., geographic regions or customer tiers):Mitigation Strategies
Pre-processing techniques reweight training samples to balance group representation. The sample weight w_i for instance i in group k is:Case Study: Cellular Network Maintenance
A major telecom provider implemented fairness-aware downtime prediction across socioeconomic regions. The original model showed 23% higher false negative rates in low-income areas due to sparse historical data. After applying adversarial debiasing—where a discriminator network penalizes group-predictive features—the disparity reduced to 4% while maintaining 92% overall accuracy. Key features contributing to bias included:- Irregular maintenance logs from third-party contractors
- Differential sensor coverage across network tiers
- Geospatial clustering of outage events
Trade-offs Between Fairness and Performance
The fairness-accuracy Pareto frontier can be derived by varying the strength λ of fairness regularization. For a model with baseline accuracy A_0 and fairness violation F_0, the trade-off follows:7.3 Mitigating Adversarial Attacks on AI Systems
Adversarial Robustness in Network Downtime Prediction
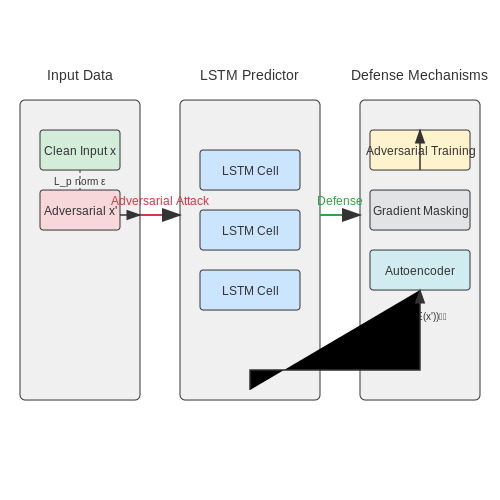
Adversarial attacks exploit the sensitivity of machine learning models to carefully crafted perturbations in input data. For network downtime prediction systems, these attacks can manifest as manipulated latency metrics, falsified packet loss reports, or spoofed traffic patterns that deceive the model into incorrect operational state classifications. The vulnerability arises from the high-dimensional, non-linear decision boundaries learned by deep neural networks, where small input changes can lead to disproportionate output shifts.
Formalizing the Threat Model
Consider a trained downtime predictor fθ with parameters θ that maps network telemetry x ∈ ℝd to downtime probability y ∈ [0,1]. An adversarial example x' satisfies:
where ε bounds the perturbation magnitude under Lp-norm constraints. The Fast Gradient Sign Method (FGSM) attack computes perturbations as:
with J being the training loss function. For network time-series data, this manifests as coordinated distortions across multiple monitoring intervals.
Defensive Strategies
Adversarial Training
Augmenting training data with generated adversarial examples improves model robustness. The min-max formulation optimizes:
For LSTM-based downtime predictors, this involves generating adversarial sequences where perturbations maintain temporal consistency in network metrics.
Gradient Masking
Defensive distillation trains a secondary model on softened probabilities from the primary model:
where T > 1 is the temperature parameter. This smooths decision boundaries, making gradient-based attacks harder to construct.
Input Reconstruction
Autoencoder-based defenses learn a manifold of valid network telemetry, filtering adversarial noise through reconstruction:
where E and D are encoder-decoder networks. This is particularly effective against universal adversarial perturbations in network traffic data.
Certifiable Defenses
Interval bound propagation provides mathematical guarantees by propagating input uncertainty through the network:
where z and z are lower/upper bounds for layer activations. For downtime prediction, this certifies that no perturbation within ε can change the prediction.
Monitoring and Detection
Anomaly detection subsystems can flag adversarial inputs by monitoring:
- Mahalanobis distance of hidden layer activations from training distribution
- Unexpected jumps in prediction confidence between consecutive time steps
- Violations of physical constraints in reconstructed network metrics
Bayesian neural networks provide uncertainty estimates that naturally increase under adversarial conditions, with the predictive variance σ2 serving as an attack indicator:
8. Key Research Papers in AI for Network Reliability
8.1 Key Research Papers in AI for Network Reliability
- PDF Implementing Machine Learning Algorithms for Predictive Network ... — network infrastructure, thereby enabling more accurate forecasting, efficient troubleshooting and improvements in network reliability and resilience. The use of machine learning algorithms in creating predictive models for network maintenance is a growing field that requires comprehensive evaluation. This research paper, therefore, aims to
- Overview of AI and Communication for 6G Network: Fundamentals ... — AI for Network is the notation of using AI to improve the performance, efficiency and user service experience of the network itself. The primary research of AI for NET includes using AI to optimize traditional algorithms, optimize network functions, optimize network operation and maintenance management, etc., to improve the transmission ...
- PDF AI-Powered Networking: Unlocking Efficiency and Performance - IJRPR — The integration of Artificial Intelligence (AI) techniques into network management brings about a paradigm shift, enabling proactive, automated, and intelligent management solutions. 2.1 Automation and Orchestration: AI empowers network automation by enabling the creation of self-configuring, self-healing, and self-optimizing networks.
- 6G Networks and the AI Revolution—Exploring Technologies, Applications ... — This synergy between AI and ultra-massive MIMO enhances network coverage and reliability while mitigating interference for improved quality of service . Beamforming AI-driven beamforming techniques enhance spectral efficiency and mitigate multi-path fading, ensuring seamless connectivity and reliability in dynamic urban environments [ 159 ].
- Enhancing Communication Networks in the New Era with Artificial ... - MDPI — Artificial intelligence (AI) transforms communication networks by enabling more efficient data management, enhanced security, and optimized performance across diverse environments, from dense urban 5G/6G networks to expansive IoT and cloud-based systems. Motivated by the increasing need for reliable, high-speed, and secure connectivity, this study explores key AI applications, including ...
- PDF TIJER || ISSN 2349-9249 || © November 2020 Volume 7, Issue 11 || www ... — promptly, reducing downtime and improving service reliability. In this paper, we delve into the mechanisms of AI-driven predictive maintenance, highlighting its advantages over traditional maintenance methods. We discuss how machine learning algorithms process real-time data from network sensors, providing actionable insights and
- Artificial Intelligence in Computer Networks: Delay Estimation, Fault ... — every node explicitly. As a result, we propose an AI-based delay measurement estimator system. The system's inputs are just the source and destination nodes' IP-addresses. Network maintainers continuously monitor their network status to detect any sudden change in the network and take suitable action(s) to
- (PDF) Generative AI for Predictive Maintenance: Predicting Equipment ... — The paper also explores the optimization of maintenance schedules using generative AI, where models simulate and compare different maintenance timing strategies, ultimately minimizing downtime and ...
- Enhancing 5G Infrastructure Reliability with AI-Driven Predictive ... — The findings reveal the promise of the AI-driven DT method, igniting a new era of efficiency and unwavering reliability in the realm of wireless 5G networks intertwined with LoRa. Discover the ...
- PDF Generative AI for Predictive Maintenance: Predicting Equipment Failures ... — Generative AI, a subset of artificial intelligence, has shown particular promise in predictive maintenance due to its ability to generate synthetic data, simulate failure scenarios, and optimize ...
8.2 Open Datasets for Downtime Prediction
- PDF Factory Downtime Prediction Using Machine Learning Algorithms - JETIR — Planned downtime prediction is used to anticipate the need for scheduled maintenance or repairs, while unplanned downtime prediction is used to anticipate unforeseen equipment failures or other events that could disrupt production. Unplanned downtime is costly for industries and predicting factory downtime duration is a challenging task due to ...
- PDF Predictive Network Maintenance: How AI Forecasts System Failures — • Prediction accuracy: Most case studies • done report > 98% performance (F1 score) in failure predictions for large datasets • Reduced downtime: Studies show that • predictive maintenance can reduce downtime by upto 50% • Cost Savings : Reduced maintenance costs • by 30-40% • Root Cause analysis: Insights into underlying issue.
- Predicting network faults with ultimate precision using AI — Hence, adopting a network event prediction model becomes imperative to anticipate and proactively mitigate potential network failures and outages. It also enables service providers to ensure precise predictions, reduce network downtime, and cut operational expenses. Fig: Key steps to leverage ML model for ticket prediction and prioritization
- PDF Towards Zero Downtime: Using Machine Learning to Predict Network ... - Itu — In this paper, we propose a machine learning-based approach to predict network failures and minimize downtime. Network performance observability data from a 5G core network testbed based on Cloud-native Network Functions (CNFs) is used to train several supervised learning models, including random forest, gradient boosting regressor ...
- Towards zero downtime: Using machine learning to predict network ... — In this paper, we propose a machine learning-based approach to predict network failures and minimize downtime. Network performance observability data from a 5G core network testbed based on Cloud ...
- Prediction Network Downtime Values Using Non-Negative Matrix ... — Estimating downtime is important for quality of a telecom service, when an outage occurs. As outage history is archived in a telecom company, historical data can be used to estimate duration of the outage in a network node for a specific telecom service. In this paper, outage duration values in a time range are modeled as time-series and non-Negative matrix factorization model is considered to ...
- Preventing IT Downtime with AI Applications and Predictive Analysis — Companies facing IT downtime issues are normal, but the way they choose to harness the threat through early prediction using AI applications like Machine Learning and Data Science can help at critical times. As many more companies are embracing technology, it is good to have a backup system or a solution ready for real-time issues.
- The MetroPT dataset for predictive maintenance - PMC — The paper describes the MetroPT data set, an outcome of a Predictive Maintenance project with an urban metro public transportation service in Porto, Portugal. ... The maintenance plan is dynamically scheduled to reduce unplanned downtime and associated costs. Additionally, by identifying the components involved and the severity of the failure ...
- Forecasting Network Traffic: A Survey and Tutorial With Open-Source ... — This paper presents a review of the literature on network traffic prediction, while also serving as a tutorial to the topic. We examine works based on autoregressive moving average models, like ARMA, ARIMA and SARIMA, as well as works based on Artifical Neural Networks approaches, such as RNN, LSTM, GRU, and CNN. In all cases, we provide a complete and self-contained presentation of the ...
- Find Open Datasets and Machine Learning Projects | Kaggle — Download Open Datasets on 1000s of Projects + Share Projects on One Platform. Explore Popular Topics Like Government, Sports, Medicine, Fintech, Food, More. Flexible Data Ingestion.
8.3 Recommended Books and Online Resources
- Prognostics and health management of electronics : fundamentals ... — An indispensable guide for engineers and data scientists in design, testing, operation, manufacturing, and maintenance A road map to the current challenges and available opportunities for the research and development of Prognostics and Health Management (PHM), this important work covers all areas of electronics and explains how to: assess ...
- (PDF) Generative AI for Predictive Maintenance: Predicting Equipment ... — Leveraging advancements in generative artificial intelligence (AI), this paper explores the role of AI-driven predictive maintenance in predicting equipment failures and optimizing maintenance ...
- An experimental hybrid customized AI and generative AI chatbot human ... — We propose the design of an experimental hybrid customized chatbot HMI that combines AI and generative AI functions to: 1. Improve factory troubleshooting downtime by enabling easy and swift equipment information retrieval while keeping factory data secure (AI function of the chatbot) 2.
- Enhancing Communication Networks in the New Era with Artificial ... — These advancements have spurred the integration of AI into communication networks, where it offers potential solutions for optimizing network resources, enhancing security, and predicting traffic patterns [7].
- Ensuring reliable network operations and maintenance: The role of PMRF ... — Consequently, the current focus of AI in network management predominantly revolves around identifying potentially faulty switches or links that may fail in the future rather than predicting maintenance-induced disruptions.
- Deep Learning — The Deep Learning textbook is a resource intended to help students and practitioners enter the field of machine learning in general and deep learning in particular. The online version of the book is now complete and will remain available online for free.
- AI Agents Revolutionize Outage Prediction 2024 — Discover how AI agents transform infrastructure resilience through advanced outage prediction. Learn about cutting-edge technologies, implementation strategies, and real-world applications across industries. Maximize uptime and minimize losses with AI-powered predictive maintenance.
- PDF Artificial Intelligence Tools: Decision Support Systems in Condition ... — — Chris Pomfret, Society for Machinery Failure Prevention Technology, Dayton, Ohio, USA "... a good reference book for students, educators, and maintenance engineers who would like to use artificial intelligence (AI) techniques for data fusion and decision making in condition monitoring and diagnosis."
- Frontmatter - Wiley Online Library — This book analyzes the risks to cloud -based application deployments achieving the same service reliability and availability as traditional deployments, as well as opportunities to improve service reliability and availability via cloud deployment.
- PDF Runtime Performance Prediction for Deep Learning Models with Graph ... — In this paper, we propose DNNPerf, a novel ML-based tool for predicting the runtime performance of deep learning models using Graph Neural Network. DNNPerf represents a model as a directed acyclic computation graph and incorporates a rich set of performance-related features based on the computational semantics of both nodes and edges.