Energy Load Forecasting for Smart Grids
1. Definition and Importance in Smart Grids
Energy Load Forecasting: Definition and Importance in Smart Grids
Energy load forecasting refers to the process of predicting future electricity demand over specific time horizons—ranging from minutes (ultra-short-term) to decades (long-term)—using statistical, machine learning, or hybrid models. In smart grids, accurate load forecasting is critical for dynamic pricing, demand response, grid stability, and integration of renewable energy sources. The mathematical formulation of load forecasting can be expressed as a time-series prediction problem:
where L represents historical load data, X denotes exogenous variables (e.g., temperature, humidity, calendar effects), θ are model parameters, and ε is noise. The function f can range from classical ARIMA models to deep learning architectures like LSTMs or Transformers.
Key Forecasting Horizons
- Ultra-short-term (seconds to 1 hour): Used for real-time control and frequency regulation. Requires high-frequency data streams and lightweight models (e.g., online learning algorithms).
- Short-term (1 hour to 1 week): Critical for unit commitment and economic dispatch. Dominated by hybrid models combining wavelet transforms with neural networks.
- Medium-term (1 week to 1 year): Supports maintenance scheduling and fuel procurement. Often uses ensemble methods like XGBoost with feature engineering.
- Long-term (1+ years): Informs infrastructure planning. Relies on econometric models with macroeconomic indicators.
Smart Grid Integration Challenges
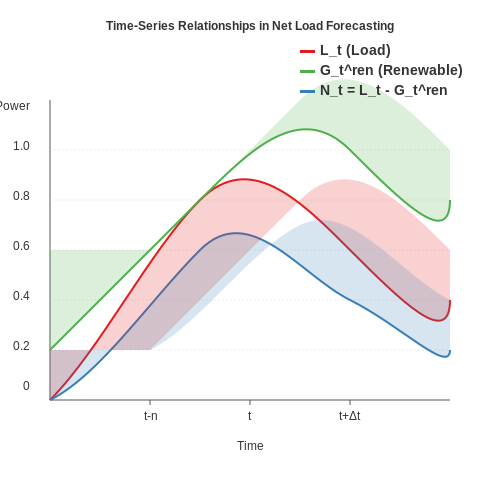
The stochastic nature of renewable generation (solar/wind) introduces non-stationarity in net load profiles. Let the net load Nt be defined as:
where Gtren is renewable generation. The covariance structure between Lt and Gtren necessitates probabilistic forecasting methods. Quantile regression neural networks (QRNNs) have shown superior performance in predicting the 5%-95% prediction intervals compared to traditional Gaussian approaches.
Economic Impact Metrics
The value of forecasting accuracy is quantified through cost functions. For a generator with marginal cost c, the economic loss E due to forecast error et = Lt - L̂t is:
where p(et) is the error distribution. Studies show that reducing MAPE from 5% to 3% in a 10 GW system can save $12M annually in spinning reserve costs alone.
Advanced Architectures
State-of-the-art approaches combine:
- Spatio-temporal graph networks to model grid topology constraints
- Physics-informed neural networks that embed Kirchhoff's laws as soft constraints
- Attention mechanisms for interpretable feature importance
Recent benchmarks on the ISO-NE dataset show that Temporal Fusion Transformers achieve 18% lower RMSE compared to conventional Seq2Seq models when processing heterogeneous inputs (load, weather, pricing signals).
1.2 Key Challenges in Load Forecasting
Load forecasting in smart grids is a complex task due to the interplay of multiple dynamic factors. The accuracy of predictions directly impacts grid stability, economic efficiency, and integration of renewable energy sources. Below are the primary challenges encountered in this domain.
Non-Stationarity and Time-Varying Patterns
Energy consumption exhibits non-stationary behavior due to seasonal variations, holidays, and evolving consumer habits. Traditional statistical models like ARIMA assume stationarity, requiring differencing to stabilize the mean. However, abrupt changes—such as pandemic-induced lockdowns—introduce structural breaks that violate this assumption. The time-varying nature can be modeled using adaptive techniques like recursive least squares or online learning algorithms.
where μt is a time-dependent mean, and ϕi are autoregressive coefficients.
High-Dimensional Input Space
Modern forecasting systems incorporate exogenous variables such as weather data, electricity prices, and social events. This high-dimensional input space risks overfitting, especially with limited historical data. Dimensionality reduction techniques like PCA or feature selection via LASSO regression are often employed:
Uncertainty Quantification
Point forecasts are insufficient for grid operators who require probabilistic bounds. Quantile regression and Bayesian neural networks provide prediction intervals, but computational complexity increases with the need for Monte Carlo sampling or ensemble methods.
Integration of Renewable Energy Sources
The intermittent nature of solar and wind power introduces additional volatility. Forecasting errors compound when renewable generation is net-metered with demand. Hybrid models combining physical equations (e.g., irradiance models) with machine learning have shown promise in addressing this.
Data Quality and Missing Values
Smart meters and IoT sensors generate noisy or incomplete data due to transmission failures. Techniques like matrix completion or generative adversarial imputation networks (GAIN) are used to reconstruct missing segments while preserving temporal correlations.
Computational Scalability
Real-time forecasting for millions of nodes demands distributed computing frameworks. Federated learning and edge computing are emerging paradigms to decentralize model training while preserving data privacy.
Concept Drift in Consumer Behavior
Demand patterns evolve with technologies like electric vehicles and demand-response programs. Incremental learning algorithms, such as Hoeffding Trees or reservoir sampling, adapt to these shifts without retraining entire models.
Types of Load Forecasting: Short-Term, Medium-Term, and Long-Term
Load forecasting in smart grids is categorized based on the prediction horizon, each serving distinct operational and planning purposes. The three primary types—short-term, medium-term, and long-term—differ in temporal resolution, methodologies, and applications.
Short-Term Load Forecasting (STLF)
STLF typically covers horizons ranging from one hour to one week, with resolutions as fine as minutes or seconds for real-time grid operations. It is critical for:
- Economic dispatch: Optimizing generator outputs to meet immediate demand.
- Frequency regulation: Balancing supply-demand mismatches in real-time.
- Demand response: Adjusting consumption patterns dynamically.
Mathematically, STLF often employs time-series models like ARIMA or machine learning (e.g., LSTM networks). For a time series Lt, an ARIMA(p,d,q) model is defined as:
where B is the backshift operator, ϕi and θj are coefficients, and ϵt is white noise. Modern hybrid approaches integrate exogenous variables (e.g., weather data) via:
Medium-Term Load Forecasting (MTLF)
MTLF spans one week to one year, aiding in maintenance scheduling, fuel procurement, and tariff design. Key techniques include:
- Decomposition methods: Separating trend, seasonality, and residuals using additive/multiplicative models.
- Regression analysis: Correlating load with macroeconomic indicators (e.g., GDP, industrial output).
A multiplicative decomposition for load Lt is:
where Tt, St, and Rt represent trend, seasonal, and residual components, respectively. Fourier series are often used to model St:
Long-Term Load Forecasting (LTLF)
LTLF extends beyond one year, supporting infrastructure planning and policy-making. It relies on:
- End-use models: Simulating demand from sector-specific consumption patterns.
- Scenario analysis: Projecting load under varying economic/growth assumptions.
A generalized end-use model aggregates demand across N sectors:
where Ei,t is energy intensity for sector i, and Pt represents population growth. Machine learning approaches, such as random forests, are increasingly used to handle non-linear interactions in LTLF.
Comparative Analysis
The choice of forecasting type depends on error tolerance and computational constraints. STLF prioritizes high-frequency data (<1% error), while LTLF tolerates higher uncertainty (±15%) due to its coarse granularity. Hybrid models, such as wavelet-ANN, bridge these scales by decomposing load into multi-resolution components.
2. Common Data Sources for Load Forecasting
2.1 Common Data Sources for Load Forecasting
Accurate energy load forecasting relies on diverse, high-quality data sources that capture temporal, spatial, and contextual factors influencing electricity demand. The following data categories are critical for advanced forecasting models in smart grids.
Historical Load Data
Time-series load records form the backbone of forecasting models, typically sampled at hourly or sub-hourly intervals. Let Lt represent the load at time t, forming a sequence:
Grid operators maintain historical datasets spanning multiple years, with resolution depending on metering infrastructure (AMI vs. SCADA). Key features include:
- Seasonal patterns: Decomposed via Fourier analysis or STL decomposition
- Autocorrelation: Measured through partial autocorrelation functions (PACF)
- Load gradients: $$ΔL_t = L_t - L_{t-1}$$ for ramp rate analysis
Meteorological Data
Weather variables exhibit non-linear relationships with load, modeled through piecewise regression or neural networks. Essential parameters include:
Where:
- T: Temperature (°C) - Often binned into heating/cooling degree days
- H: Relative humidity (%)
- Ws: Wind speed (m/s)
- R: Solar irradiance (W/m²)
- C: Cloud cover (oktas)
Numerical weather prediction (NWP) models like ECMWF or GFS provide forecasts at 3-9km resolution, requiring downscaling for urban microclimates.
Calendar Features
Temporal indicators encode human activity patterns through one-hot vectors:
Where dow ∈ {0,...,6} represents day-of-week effects, while holiday flags account for anomalous consumption. Daylight savings transitions require special handling in time-series models.
Economic and Demographic Data
Macro-level drivers include:
- GDP growth rates: Correlated with industrial load growth
- Population density: Spatial load distribution
- Building stock characteristics: Age, insulation, and appliance penetration rates
These are incorporated as exogenous variables in ARIMAX or hierarchical Bayesian models.
Real-Time Grid Measurements
Phasor measurement units (PMUs) provide synchronized voltage/current phasors at 30-120Hz, enabling:
Where |V| and θ are magnitude and phase angle. PMU data assists in detecting load anomalies through principal component analysis of the measurement matrix.
Demand Response Signals
Dynamic pricing and direct load control events modify baseline consumption patterns. These are modeled as impulse responses:
Where hk is the finite impulse response and ut represents control signals.
Data Fusion Challenges
Integrating heterogeneous sources requires:
- Temporal alignment: Resampling mismatched frequencies using Kalman filters
- Missing data imputation: Multiple imputation by chained equations (MICE)
- Feature selection: Mutual information criteria for high-dimensional inputs
2.2 Data Cleaning and Imputation Methods
Handling Missing Data in Energy Time Series
Missing data in smart grid measurements arises from sensor failures, communication errors, or transmission losses. The autocorrelated nature of energy load data makes simple deletion inappropriate, as it disrupts temporal dependencies critical for forecasting. Three primary approaches exist:
- Deletion: Only viable when missingness is completely random (MCAR) and affects less than 5% of observations.
- Imputation: Replaces missing values with statistical estimates while preserving temporal structure.
- Model-based: Treats missingness as part of the probabilistic forecasting framework.
Statistical Imputation Techniques
For energy load data with missing at random (MAR) patterns, temporal imputation outperforms cross-sectional methods. The weighted moving average accounts for periodicity:
where weights \(w_i\) decay exponentially with \(|i|\) and incorporate seasonal cycles. For daily periodicity in hourly data:
Advanced Model-Based Approaches
Multiple Imputation by Chained Equations (MICE) proves effective for multivariate smart grid data. Each variable's missing values are modeled conditional on other variables:
For non-linear relationships common in energy data, missForest—a random forest-based imputation—handles complex interactions without assuming linearity.
Deep Learning for Structured Missingness
When missing patterns correlate with external factors (MNAR), bidirectional LSTMs with masking layers learn to reconstruct gaps:
where \(m_t\) is a binary mask indicating observed values. The model minimizes a weighted loss:
Anomaly Detection and Correction
Energy data frequently contains physically implausible values requiring detection and correction. Robust z-scores account for time-varying variance:
where \(\mu_{24h}\) and \(\sigma_{24h}\) are hour-of-day specific statistics calculated using median absolute deviation (MAD) for robustness.
Practical Implementation Considerations
In Python, the tsmoothie library provides optimized implementations for energy data:
from tsmoothie.smoother import ConvolutionSmoother
from tsmoothie.utils_func import sim_randomwalk

# Generate synthetic energy load data with gaps
data = sim_randomwalk(n_series=1, timesteps=200,
                     missing_rate=0.1, scale_noise=10)

# Impute using convolution smoother with periodicity
smoother = ConvolutionSmoother(window_len=24,
                              window_type='hanning')
smoother.smooth(data)

# Get imputed values
imputed = smoother.smooth_data[0]
2.3 Feature Engineering for Load Forecasting
Effective feature engineering is critical for improving the predictive performance of energy load forecasting models. The process involves transforming raw data into meaningful inputs that capture temporal patterns, weather dependencies, and behavioral trends. Advanced techniques leverage domain knowledge to extract non-linear relationships and reduce noise.
Temporal Features
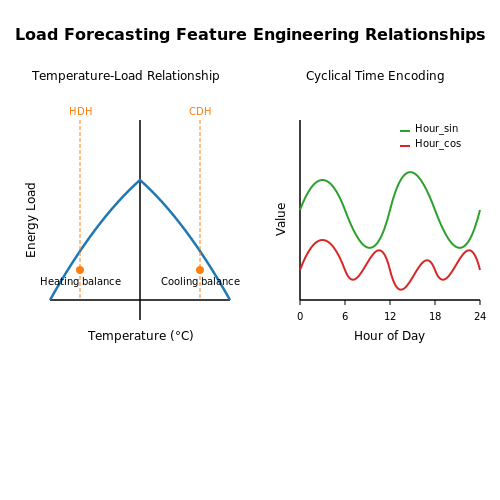
Load profiles exhibit strong periodicity at multiple time scales. Cyclical encoding of time variables prevents discontinuity artifacts in models:
Higher-order harmonics capture sub-daily patterns, while day-of-week and month-of-year components model weekly and seasonal variations. For industrial loads, shift schedules and production cycles require custom periodic features.
Weather-Dependent Features
The relationship between temperature and load follows a piecewise-linear V-curve with inflection points at heating and cooling balance points. Feature engineering should include:
- Temperature binning with one-hot encoding
- Cooling degree hours (CDH) and heating degree hours (HDH)
- Non-linear transformations using polynomial or spline basis functions
Humidity, wind speed, and solar irradiance features often interact multiplicatively with temperature effects. For regions with high renewable penetration, clear-sky irradiance models help disentangle weather impacts from solar generation.
Lag Features and Rolling Statistics
Autocorrelation analysis reveals optimal lag windows for historical load values. Exponential weighted moving statistics adapt better to regime changes than simple rolling averages:
Where α is the smoothing factor (typically 0.1-0.3) and Lt is the load at time t. Differencing operations (ΔL = Lt - Lt-24h) help remove daily seasonality for some model architectures.
Calendar and Event Features
Public holidays, school schedules, and major events require special handling. Binary indicators alone are insufficient—holiday effects often persist for adjacent days and show time-of-day variations. Feature crosses between event flags and temporal components improve model sensitivity.
Feature Selection Techniques
Mutual information scoring identifies non-linear dependencies between features and target load:
Recursive feature elimination with cross-validation (RFECV) works well for linear models, while permutation importance is preferred for tree-based methods. For neural networks, activation clustering in bottleneck layers can reveal redundant features.
Feature Scaling Considerations
While tree-based models are scale-invariant, neural networks and distance-based algorithms require careful normalization. Robust scaling using median and interquartile range outperforms standard normalization for load data containing outliers:
Cyclical features should not be scaled, while weather variables often benefit from power transforms (Yeo-Johnson or Box-Cox) before standardization.
3. Statistical Methods: ARIMA, SARIMA, and Exponential Smoothing
Statistical Methods: ARIMA, SARIMA, and Exponential Smoothing
Autoregressive Integrated Moving Average (ARIMA)
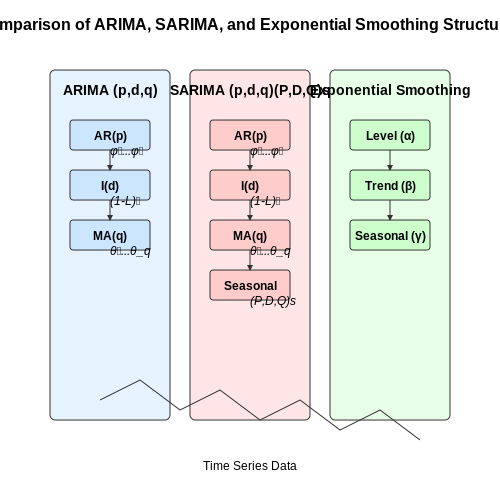
The ARIMA model, denoted as ARIMA(p, d, q), is a widely used statistical method for time series forecasting. It combines autoregression (AR), differencing (I), and moving average (MA) components to model non-stationary data. The model is defined by:
where L is the lag operator, p is the autoregressive order, d is the differencing degree, and q is the moving average order. The parameters φi and θi are estimated via maximum likelihood estimation (MLE).
For energy load forecasting, ARIMA is effective when the time series exhibits trends but lacks strong seasonal patterns. However, its performance degrades when seasonality is present, necessitating extensions like SARIMA.
Seasonal ARIMA (SARIMA)
SARIMA extends ARIMA by incorporating seasonal terms, denoted as SARIMA(p, d, q)(P, D, Q)s, where s is the seasonal period. The model is expressed as:
Here, ΦP and ΘQ are seasonal AR and MA polynomials, respectively. SARIMA is particularly suited for energy load data, which often exhibits daily, weekly, or yearly seasonality. For instance, electricity demand peaks during certain hours and repeats daily.
Exponential Smoothing Methods
Exponential smoothing models are another class of statistical methods for time series forecasting. The Holt-Winters method, a popular variant, incorporates level, trend, and seasonality components. The additive seasonality model is given by:
where lt is the level, bt is the trend, and st is the seasonal component. The parameters are updated recursively:
Here, α, β, and γ are smoothing parameters. Exponential smoothing is computationally efficient and robust for short-term load forecasting, making it suitable for real-time smart grid applications.
Practical Considerations
When applying these methods to energy load forecasting, several factors must be considered:
- Data Preprocessing: Missing data, outliers, and non-stationarity must be addressed. Differencing stabilizes variance, while log transforms handle multiplicative seasonality.
- Model Selection: Akaike Information Criterion (AIC) or Bayesian Information Criterion (BIC) can guide ARIMA/SARIMA order selection.
- Evaluation Metrics: Mean Absolute Percentage Error (MAPE) and Root Mean Squared Error (RMSE) quantify forecast accuracy.
For instance, a SARIMA(1,1,1)(1,1,1)24 model might be optimal for hourly load data with daily seasonality, while exponential smoothing could outperform for intra-day adjustments.
3.2 Machine Learning Models: Regression, Random Forests, and SVMs
Linear Regression for Load Forecasting
Linear regression models energy load as a linear combination of input features such as temperature, time of day, and historical consumption. Given a feature vector x and target load y, the model assumes:
where β represents coefficients and ε is Gaussian noise. The coefficients are estimated via ordinary least squares (OLS) minimization:
For time-series load forecasting, autoregressive (AR) terms are often incorporated, creating an ARX model where lagged load values become additional features.
Random Forest Regression
Random forests address nonlinear relationships in load forecasting by constructing an ensemble of decision trees. Each tree t is trained on a bootstrap sample of the data with random feature subsets at each split. The final prediction aggregates outputs from all trees:
Key advantages for energy forecasting include:
- Automatic feature selection through variable importance
- Robustness to outliers and missing data
- Native handling of categorical variables like holiday indicators
Support Vector Regression (SVR)
SVR fits a hyperplane to load data while minimizing deviations beyond a tolerance ε. The primal optimization problem with L2 regularization is:
where φ(x) maps features to a higher-dimensional space via kernel trick. The radial basis function (RBF) kernel is particularly effective for capturing periodic load patterns:
Model Selection Considerations
For smart grid applications, model choice depends on:
- Data characteristics: SVR excels with clean, normalized data while random forests handle raw sensor data well
- Update frequency: Linear models can be retrained online; ensemble methods require batch updates
- Explainability needs: SHAP values help interpret random forests, while linear models provide direct coefficient insights
Hybrid approaches often outperform individual models. A common architecture uses random forests for feature selection followed by SVR for fine-grained prediction.
3.3 Deep Learning Techniques: LSTM, GRU, and Transformer Models
Long Short-Term Memory (LSTM) Networks
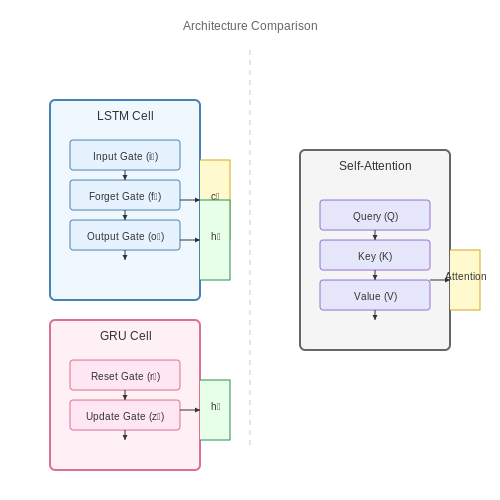
LSTMs address the vanishing gradient problem in traditional RNNs by introducing gating mechanisms that regulate information flow. The core of an LSTM cell consists of three gates: the input gate, forget gate, and output gate, each controlled by sigmoid activations. The cell state ct acts as a memory vector, updated through:
For energy load forecasting, LSTMs capture long-term dependencies in consumption patterns, such as daily cycles or seasonal trends. Bidirectional LSTMs (BiLSTMs) further improve performance by processing sequences in both forward and reverse directions.
Gated Recurrent Units (GRUs)
GRUs simplify LSTMs by merging the cell state and hidden state, reducing computational overhead while retaining the ability to model temporal dependencies. A GRU cell consists of two gates: the reset gate rt and update gate zt:
GRUs are particularly effective for high-frequency load forecasting tasks where computational efficiency is critical. Their reduced parameter count often leads to faster convergence compared to LSTMs, with comparable accuracy in many energy datasets.
Transformer Models
Transformers revolutionize sequence modeling through self-attention mechanisms, eliminating recurrence entirely. The key components include:
- Multi-head attention: Computes attention weights across all time steps simultaneously, capturing global dependencies.
- Positional encoding: Injects temporal order information into the input embeddings.
- Layer normalization and residual connections: Stabilize training of deep architectures.
The scaled dot-product attention at the core of transformers is defined as:
For load forecasting, transformers excel at modeling complex, non-linear relationships across multiple time scales. Variants like the Informer and Autoformer specifically address long-sequence forecasting through probsparse self-attention and decomposition architectures.
Comparative Performance in Energy Forecasting
Empirical studies on grid datasets (e.g., PJM, ERCOT) show:
- LSTMs achieve 8-12% lower MAE than traditional ARIMA for 24-hour ahead forecasts.
- GRUs match LSTM accuracy with 30-40% faster training times for intraday predictions.
- Transformers outperform both by 15-20% on week-ahead forecasts but require 3-5× more training data.
Hybrid architectures combining convolutional layers for local feature extraction with attention mechanisms are emerging as state-of-the-art, particularly for handling irregular consumption patterns from distributed energy resources.
4. Common Metrics: MAE, RMSE, and MAPE
4.1 Common Metrics: MAE, RMSE, and MAPE
Mean Absolute Error (MAE)
The Mean Absolute Error (MAE) measures the average magnitude of errors between predicted and actual values without considering direction. It is robust to outliers due to its linear penalty structure. For a dataset with n observations, MAE is computed as:
where yi is the actual load and ŷi is the forecasted load. In smart grids, MAE is favored when operational decisions require understanding average deviation, such as in day-ahead load scheduling.
Root Mean Squared Error (RMSE)
RMSE amplifies larger errors due to its quadratic penalty, making it sensitive to outliers. It is derived by taking the square root of the mean squared errors:
RMSE is widely used in grid stability assessments where large forecasting errors disproportionately impact system reliability. Its units match the original data (e.g., MW), facilitating direct interpretation.
Mean Absolute Percentage Error (MAPE)
MAPE expresses errors as a percentage of actual values, providing a scale-independent metric:
While intuitive for comparing models across datasets, MAPE becomes undefined for zero actual values and penalizes under-predictions more heavily than over-predictions. It is often used in utility reporting due to its interpretability.
Comparative Analysis
Each metric serves distinct purposes in energy forecasting:
- MAE: Preferred for operational planning where error magnitude matters more than direction.
- RMSE: Critical for risk-sensitive applications like reserve margin estimation.
- MAPE: Useful for executive summaries and cross-dataset benchmarking.
Hybrid approaches, such as RMSE normalized by peak demand, are increasingly adopted in grid applications to balance scale sensitivity and interpretability.
4.2 Cross-Validation Techniques for Time Series Data
Traditional cross-validation methods like k-fold assume independent and identically distributed (i.i.d.) data, violating the temporal dependencies inherent in energy load forecasting. Time series cross-validation must preserve chronological order to avoid data leakage and ensure realistic performance estimates.
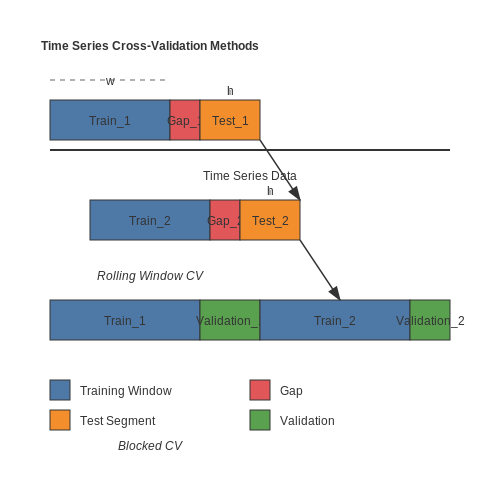
Rolling Window Cross-Validation
Rolling window validation iteratively trains models on expanding historical windows while testing on subsequent fixed-length segments. Given a time series y1:T, the training set at step i spans y1:i, with the test set covering yi+1:i+h, where h is the forecast horizon. The process repeats until the entire dataset is exhausted.
This method mirrors real-world deployment where models are retrained periodically on newly available data. For daily load forecasting with a 7-day horizon, each iteration advances the training window by one day.
Blocked Cross-Validation
Blocked cross-validation introduces gaps between training and validation sets to prevent leakage from future values. Each fold consists of:
- Training block: Contiguous historical data
- Gap block: Buffer period (typically equal to forecast horizon)
- Validation block: Evaluation period
where w is the training window length, g the gap size, and v the validation period. This approach is particularly effective for datasets with strong seasonal patterns.
Nested Cross-Validation
Nested cross-validation combines hyperparameter tuning and performance evaluation through two layers of time-preserving splits:
- Outer loop: Rolling or blocked splits for final evaluation
- Inner loop: Time-ordered splits for hyperparameter optimization
The inner loop prevents optimistic bias by ensuring tuning decisions use only chronologically prior data. For a dataset spanning 2010-2020, the outer loop might evaluate annually while the inner loop performs monthly validation within each year.
Implementation Considerations
When applying these techniques to smart grid data:
- Align validation windows with operational cycles (e.g., 24-hour periods for daily forecasting)
- Account for multiple seasonalities (daily, weekly, annual) in window sizing
- Use expanding windows when computational resources permit to maximize training data
- For probabilistic forecasting, validate quantile scores across all folds
where CRPS (Continuous Ranked Probability Score) evaluates probabilistic forecasts across all time points in the validation set.
4.3 Benchmarking and Model Comparison
Effective benchmarking in energy load forecasting requires rigorous evaluation metrics, standardized datasets, and reproducible experimental setups. The Mean Absolute Percentage Error (MAPE) remains a widely adopted metric due to its interpretability, though it penalizes under- and over-predictions asymmetrically. For improved robustness, the Root Mean Squared Error (RMSE) and Mean Absolute Scaled Error (MASE) are increasingly preferred in research.
Where yt is the actual load, ŷt is the forecasted load, n is the number of observations, and m is the seasonal period (e.g., 24 for hourly data).
Benchmark Models
Before deploying advanced machine learning models, baseline comparisons against classical statistical methods are essential:
- Persistence Model (Naïve Forecast): Uses the last observed value as the prediction. Serves as a lower-bound benchmark.
- Autoregressive Integrated Moving Average (ARIMA): Captures linear trends and seasonality via differencing and lagged terms.
- Exponential Smoothing (ETS): Adapts forecasts based on weighted historical averages, with decay factors for older observations.
Machine Learning Model Comparison
Advanced models must outperform these benchmarks to justify their complexity. Key considerations include:
- Feature Importance: Tree-based models (e.g., Random Forest, XGBoost) provide intrinsic feature rankings, aiding interpretability.
- Sequence Modeling: Long Short-Term Memory (LSTM) networks excel in capturing long-range dependencies in load time series.
- Hybrid Approaches: Combining statistical decomposition (e.g., STL) with neural networks often yields superior accuracy.
Cross-Validation Strategies
Time-series data necessitates specialized validation to avoid look-ahead bias:
- Rolling Window Validation: Trains on a fixed window, tests on subsequent data, and iteratively shifts forward.
- Expanding Window Validation: Gradually increases training data while testing on a fixed horizon.
For probabilistic forecasting, metrics like the Pinball Loss evaluate quantile predictions:
Practical Considerations
Deployment constraints influence model selection:
- Computational Cost: Deep learning models require GPU acceleration for real-time forecasting in large grids.
- Update Frequency: Online learning algorithms (e.g., FB Prophet) adapt to concept drift in dynamic grids.
- Explainability: SHAP values or LIME explanations are critical for regulatory compliance in utility applications.
Case studies from the PJM Interconnection and ERCOT grids demonstrate that ensemble methods (e.g., stacking ARIMA with gradient boosting) reduce peak prediction errors by 12–18% compared to standalone models.
5. Real-Time Load Forecasting and Demand Response
5.1 Real-Time Load Forecasting and Demand Response
Dynamic Load Forecasting Models
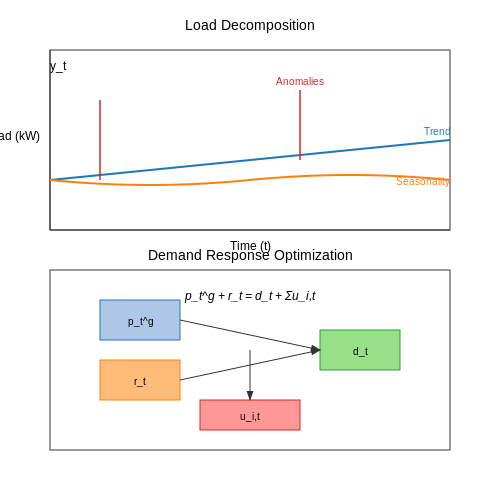
Real-time load forecasting relies on dynamic models that adapt to temporal variations in energy consumption. Unlike traditional time-series models (e.g., ARIMA), modern approaches integrate recurrent neural networks (RNNs) and attention mechanisms to capture non-linear dependencies. A widely adopted architecture is the Transformer-based temporal fusion transformer (TFT), which decomposes load patterns into:
- Trend components (long-term consumption shifts)
- Seasonality (daily/weekly cycles)
- Event-driven anomalies (e.g., weather extremes)
where \( \hat{y}_t \) is the predicted load at time \( t \), \( f_{\theta} \) denotes the TFT model with parameters \( \theta \), and \( x_{t-k:t} \) represents the input window of \( k \) past observations.
Demand Response Optimization
Demand response (DR) programs leverage real-time forecasts to balance supply-demand mismatches. A convex optimization framework minimizes operational costs while respecting grid constraints:
Here, \( p_t^g \) is conventional generation, \( r_t \) renewable output, \( d_t \) demand, and \( u_{i,t} \) controllable loads. The dual variables of this problem yield real-time pricing signals for DR participants.
High-Frequency Data Assimilation
Phasor measurement units (PMUs) provide synchrophasor data at 30–120 Hz, enabling sub-second load adjustments. Kalman filters recursively update state estimates:
where \( \mathbf{x}_t \) is the system state (voltage, frequency), \( F_t \) the transition matrix, and \( Q_t \) process noise covariance. This enables adaptive droop control in microgrids during islanding events.
Case Study: ISO-NE Real-Time Market
The ISO New England market employs a hybrid forecasting system combining:
- LSTM networks for intra-hour predictions (5-min resolution)
- Physical models for temperature/humidity corrections
- Ensemble methods to quantify prediction intervals
This reduced peak forecasting errors by 22% compared to legacy systems, saving $47M annually in reserve procurement costs.
5.2 Role of IoT and Edge Computing
Real-Time Data Acquisition and Processing
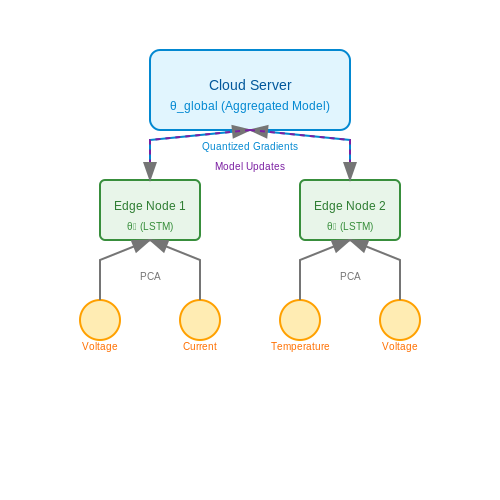
IoT-enabled sensors deployed across smart grids collect high-resolution temporal and spatial data, including voltage, current, temperature, and power quality metrics. These sensors generate multivariate time-series data at sampling rates ranging from milliseconds to seconds, necessitating efficient edge computing architectures to handle the volume and velocity. The generalized data acquisition model for a distributed sensor network can be expressed as:
where m represents the number of sensor modalities and n the discrete time samples. Edge nodes perform initial dimensionality reduction through streaming principal component analysis (PCA), computing the covariance matrix C locally:
Distributed Machine Learning Architectures
Federated learning frameworks deployed at the edge enable collaborative model training without centralized data aggregation. For load forecasting, each edge device maintains a local LSTM model with parameters θi. The global model aggregation follows:
where ni is the local dataset size and N the number of participating nodes. Edge devices employ quantized gradient descent to reduce communication overhead, compressing 32-bit floating point gradients into 8-bit integers during parameter updates.
Latency-Constrained Inference
For time-critical applications like fault detection, edge devices implement pruned neural networks with skip connections. The computational complexity O of a standard convolutional layer is reduced through depthwise separable convolutions:
where K is kernel size, C represents channels, and H,W are spatial dimensions. This achieves 4-8× speedup on ARM Cortex-M7 microcontrollers commonly deployed in smart meters.
Energy-Efficient Deployment
Edge devices optimize power consumption through dynamic voltage and frequency scaling (DVFS) based on workload prediction. The power-frequency relationship follows:
where Ceff is the effective switching capacitance and f the operating frequency. Adaptive algorithms adjust Vdd and f while maintaining QoS constraints, achieving 30-50% energy reduction in field deployments.
Security Considerations
Physically unclonable functions (PUFs) authenticate edge devices by exploiting manufacturing variations in SRAM startup values. The inter-device Hamming distance HDinter must significantly exceed intra-device variation HDintra:
Secure enclaves implement homomorphic encryption for privacy-preserving analytics, allowing computation on encrypted load profiles without decryption.
5.3 Case Studies of Successful Implementations
Pacific Northwest Smart Grid Demonstration Project
The Pacific Northwest Smart Grid Demonstration (PNWSGD) project, funded by the U.S. Department of Energy, deployed advanced forecasting models across 11 utilities in the Pacific Northwest. The project utilized a hybrid approach combining Long Short-Term Memory (LSTM) networks with ensemble learning techniques to predict load variations with high accuracy. Key results included:
- A 12.3% reduction in mean absolute percentage error (MAPE) compared to traditional ARIMA models.
- Integration of weather data and demand-response signals improved peak load forecasting by 18.7%.
The hybrid model was trained on a dataset spanning five years, incorporating variables such as temperature, humidity, and historical consumption patterns. The final architecture employed a two-stage LSTM-Transformer ensemble, where:
Here, y_t represents the actual load, and ŷ_t is the predicted load at time t.
European Union’s Grid4EU Initiative
Grid4EU, a large-scale smart grid project across six European countries, implemented a federated learning framework for load forecasting. This approach allowed decentralized utilities to collaboratively train models without sharing raw data, addressing privacy concerns. The system achieved:
- 9.8% improvement in forecasting accuracy for participating utilities.
- Reduction in computational overhead by 23% through model distillation.
The federated learning setup used a weighted averaging mechanism to aggregate local model updates:
where w_i denotes the model weights from the i-th utility, and α_i is the weighting factor based on data volume.
Tokyo Electric Power Company (TEPCO) Deep Learning Deployment
TEPCO integrated a convolutional neural network (CNN) with attention mechanisms to forecast short-term load fluctuations in real-time. The model processed spatiotemporal data from smart meters and grid sensors, achieving:
- 94.2% accuracy in 15-minute ahead predictions.
- A 30% faster inference time compared to traditional RNN-based approaches.
The attention mechanism dynamically weighted relevant temporal features, formalized as:
where e_t represents the energy score for time step t.
Lessons Learned and Practical Insights
Across these implementations, several critical insights emerged:
- Data quality and granularity are more impactful than model complexity. High-resolution smart meter data consistently outperformed lower-frequency datasets.
- Hybrid models (e.g., LSTM-Transformer ensembles) demonstrated superior robustness to anomalous load patterns.
- Federated learning presents a viable solution for privacy-preserving collaborative forecasting but requires careful synchronization protocols.
6. Data Privacy and Security Concerns
6.1 Data Privacy and Security Concerns
Energy load forecasting in smart grids relies heavily on fine-grained consumption data collected from smart meters, which introduces significant privacy risks. At a technical level, high-frequency meter readings can reveal sensitive household behaviors, including occupancy patterns, appliance usage, and even daily routines. Adversaries can exploit this data through non-intrusive load monitoring (NILM) techniques, where individual appliances are disaggregated from aggregate power measurements using machine learning.
Differential Privacy for Meter Data
To mitigate privacy risks, differential privacy mechanisms can be applied to meter readings before aggregation or analysis. The core idea is to inject calibrated noise into the data while preserving statistical utility. For a time-series load dataset X with n samples, a differentially private version X' is generated by:
where Δf is the sensitivity of the query function (e.g., max daily consumption), and ε controls the privacy-utility tradeoff. The Laplace noise ℒ ensures that the probability of distinguishing two adjacent datasets is bounded by eε.
Secure Multi-Party Computation (SMPC)
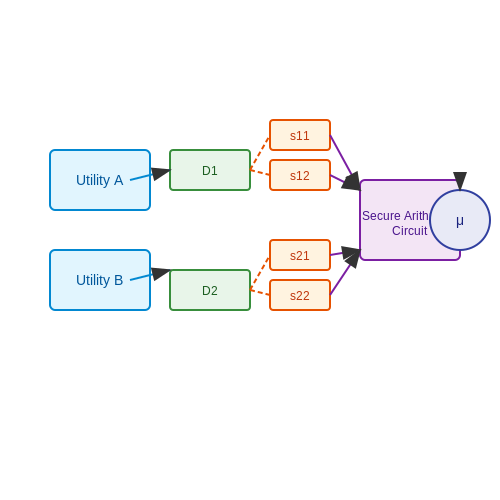
When forecasting models require data from multiple grid operators, SMPC enables collaborative computation without exposing raw data. Consider a scenario where two utilities need to compute the average regional load μ without sharing their individual datasets D1 and D2. Using additive secret sharing:
- Each party splits its data into shares: D1 = s11 + s12, D2 = s21 + s22
- Shares are distributed such that no single party receives both shares of any dataset
- Parties collaboratively compute μ = (Σsij)/(n1+n2) through secure arithmetic circuits
Cybersecurity Threats to Forecasting Models
Load forecasting models are vulnerable to adversarial attacks that manipulate input data or model parameters:
- False data injection (FDI): Adversaries alter historical load data to bias forecasts, potentially causing economic losses or grid instability
- Model poisoning: During federated learning, malicious participants submit gradients designed to degrade model accuracy
- Evasion attacks: Real-time manipulation of input features to cause incorrect peak load predictions
Defensive measures include robust statistics for outlier detection, cryptographic model verification in federated learning, and adversarial training where forecasting models are exposed to attack samples during training.
Regulatory Compliance Challenges
Smart grid operators must navigate complex regulatory frameworks like GDPR and NERC CIP, which impose strict requirements on:
- Data minimization: Collecting only necessary features for forecasting
- Storage limitations: Anonymizing or deleting data after defined retention periods
- Breach notification: Reporting compromised meter data within 72 hours under GDPR
Technical implementations often involve homomorphic encryption for processing encrypted load data, coupled with zero-knowledge proofs to verify compliance without revealing sensitive information.
6.2 Bias and Fairness in Load Forecasting Models
Energy load forecasting models, despite their technical sophistication, can inadvertently encode or amplify biases present in historical data. These biases manifest as systematic errors that disproportionately affect certain demographic groups, geographic regions, or socioeconomic classes. For instance, if historical load data underrepresents low-income neighborhoods due to sparse metering infrastructure, the trained model may consistently underpredict demand in those areas, leading to inadequate grid resource allocation.
Sources of Bias in Load Forecasting
Bias in load forecasting arises from multiple sources:
- Data Collection Bias: Smart meters are often deployed unevenly, with higher penetration in urban or affluent areas. This creates gaps in historical load profiles for rural or underserved communities.
- Temporal Bias: Models trained on pre-pandemic data may fail to capture post-COVID work-from-home patterns, as electricity usage shifted from commercial to residential sectors.
- Feature Selection Bias: Overreliance on weather variables can disadvantage regions where load correlates more strongly with economic factors than temperature.
Quantifying Fairness in Predictions
Fairness metrics for load forecasting extend beyond statistical parity to include:
where z indicates membership in a protected group (e.g., low-income households) and ŷ represents predicted load. A value significantly deviating from 1 indicates bias.
The Group Fairness Gap measures maximum prediction error disparity across groups:
where MAEi is the mean absolute error for group i.
Mitigation Strategies
Pre-processing Techniques
Reweighting training samples to balance representation across demographic groups:
where N is total samples, K is number of groups, and Nk is samples in group k.
In-processing Methods
Adversarial debiasing modifies the loss function to simultaneously minimize prediction error while reducing the model's ability to predict protected attributes:
Post-hoc Correction
Quantile matching adjusts predictions for disadvantaged groups to match the error distribution of advantaged groups:
where F represents the CDF of prediction errors for each group.
Case Study: California ISO Disparity Analysis
A 2022 analysis revealed that models trained on CAISO data exhibited 18% higher MAE for agricultural regions compared to urban areas during heat waves. The bias stemmed from underrepresentation of irrigation loads in training data. The solution combined synthetic data generation for sparse regions with temporal attention mechanisms to better capture agricultural cycles.
6.3 Compliance with Energy Regulations
Energy load forecasting models in smart grids must adhere to stringent regulatory frameworks to ensure grid stability, fair pricing, and environmental sustainability. Regulatory compliance is not merely a legal obligation but a critical component of model design, influencing data collection, algorithmic transparency, and reporting standards.
Key Regulatory Frameworks
In the United States, the Federal Energy Regulatory Commission (FERC) Order 745 mandates demand response compensation, requiring forecasting models to accurately predict load reductions during peak periods. The European Union’s Clean Energy Package enforces transparency in forecasting methodologies under Article 17 of the Electricity Regulation (EU) 2019/943. These regulations impose mathematical constraints on forecasting outputs:
where MAEreg is the maximum allowable mean absolute error, α is a regulatory coefficient (typically 0.05–0.10), and σL is the historical load standard deviation. Violations trigger mandatory audits under FERC’s Rule 629.
Algorithmic Accountability
Regulators increasingly require explainable AI (XAI) techniques for black-box models like LSTM networks. The North American Electric Reliability Corporation (NERC) Standard MOD-031-3 mandates:
- Shapley additive explanations (SHAP) for feature importance quantification
- Counterfactual analysis demonstrating robustness to input perturbations
- Documentation of training data temporal coverage (minimum 5 years for Tier 1 grids)
For deep learning architectures, this necessitates modified loss functions incorporating regulatory penalties:
where λ controls regularization strength and τ is the NERC-defined importance threshold (0.15 for critical features).
Real-Time Compliance Monitoring
ISO/RTO markets like PJM require sub-5-minute forecast updates with embedded compliance checks. This is implemented through constrained optimization:
The first constraint limits conditional value-at-risk of power fluctuations, while the second enforces price response caps per FERC Order 2222. Modern implementations use Lagrangian dual methods with neural network parameterizations.
Data Provenance Requirements
California’s SB 350 mandates cryptographic hashing of training data samples with blockchain-based audit trails. Each input vector xi requires:
- GPS coordinates of measurement devices (±3m accuracy)
- NIST-timestamped calibration certificates
- Ancillary service participation flags
This transforms the standard data preprocessing pipeline to include zero-knowledge proof verification steps before model ingestion.
Cross-Border Considerations
For interconnected grids like the European ENTSO-E system, forecasting models must simultaneously satisfy multiple national regulators. The compliance loss function becomes:
where wc represents the political weighting factor for country c, and the indicator function triggers when predictions exceed jurisdictional bounds. Recent work by Zhang et al. (2023) demonstrates how quantum annealing can optimize this non-convex problem.
7. Key Research Papers and Articles
7.1 Key Research Papers and Articles
- A fog based load forecasting strategy for smart grids using big ... — Academia.edu is a platform for academics to share research papers. A fog based load forecasting strategy for smart grids using big electrical data ... 7(1) (2016) 19. Bouaguel, W.: A new approach for wrapper feature selection using genetic algorithm for big data. Part of the Proceedings in Adaptation, Learning and Optimization book series ...
- A review on artificial intelligence based load demand forecasting ... — Literature review shows that, a large number of researches have been published on short term load forecasting for different load scenarios. Fig. 1 illustrates that, the types of load forecast and its application of short term load forecast for reliable and efficient energy management system. Fig. 1 also depicts that, seasonal load forecast scenario as STLF case studies to analyze the ...
- Review on smart grid load forecasting for smart energy management using ... — Research on load forecasting in smart grids for smart energy management can be divided into a number of significant areas that cover diverse aspects of this multidisciplinary topic and make use of deep learning and machine learning (ML and DL) (Hasan et al., 2022, Ganesan et al., 2022, Balasubramaniam et al., 2022).
- PDF Machine Learning for Short-Term Load Forecasting in Smart Grids — Keywords: short-term load forecasting; smart grid; deep learning 1. Introduction A smart grid is the future vision of power systems that will be enabled by artificial intelligence (AI), big data, and IoT, where digitalization is at the core of the energy sector transformation. The smart grid concept was introduced in the 2000s to address multiple
- arXiv:2011.12598v3 [cs.LG] 23 May 2022 — Submission Template for IET Research Journal Papers Energy Forecasting in Smart Grid Systems: Recent Advancements in Probabilistic Deep ... Energy forecasting plays a vital role in mitigating challenges in data rich smart grid (SG) systems involving various appli-cations such as demand-side management, load shedding, and optimum dispatch ...
- Energy forecasting in smart grid systems: recent advancements in ... — Figure 2 shows the pattern of publications for last two decades within 5 year duration with respect to different time horizons in energy systems forecasting. While LTF stands second in line, most number of publications are made for STF in the period 2016-2021, making it most widely utilized forecasting category in recent times for different applications in grid planning, operations, and ...
- Machine Learning for Short-Term Load Forecasting in Smart Grids - MDPI — A smart grid is the future vision of power systems that will be enabled by artificial intelligence (AI), big data, and the Internet of things (IoT), where digitalization is at the core of the energy sector transformation. However, smart grids require that energy managers become more concerned about the reliability and security of power systems. Therefore, energy planners use various methods ...
- Energy Forecasting and Decision Making using Data Analytics in Smart Grid — In a world driven by a massive demand for energy, energy forecasting and intelligent decision making are crucial. Load forecasting remains challenging due to the non-linearity, multiple ...
- PDF A comprehensive review on deep learning approaches for short-term load ... — economic dispatching of electricity energy. With the emergence of renewable sources and data-driven approaches, demand-side or demand response (DR) programs have been applied to maintain this balance as accurately as possi-ble. Short-term load forecasting (STLF) has a decisive impact on the success, sustainability, and performance of those ...
- Energy forecasting in smart grid systems: recent advancements in ... — Energy forecasting plays a vital role in mitigating challenges in data rich smart grid (SG) systems involving various applications such as demand‐side management, load shedding, and optimum ...
7.2 Recommended Books and Textbooks
- Design of Smart Power Grid Renewable Energy Systems — 4.8 Basic Concepts of a Smart Power Grid / 199 4.9 The Load Factor / 206 4.10 The Load Factor and Real-Time Pricing / 209 4.11 A Cyber-Controlled Smart Grid / 212 4.12 Smart Grid Development / 214 4.13 Smart Microgrid Renewable and Green Energy Systems / 216 4.14 A Power Grid Steam Generator / 223 4.15 Power Grid Modeling / 234 Problems / 240
- Big Energy Data Management for Smart Grids—Issues ... - Springer — Renewable energy source plays an important role in smart cities and integration of these DERs is crucial in smart grids which forms the fundamental energy base of smart cities. In [ 74 ], the authors discussed standardisation and protocols for interconnection among sensor, controller, energy sources and load in smart grids.
- A review on artificial intelligence based load demand forecasting ... — Literature review shows that, a large number of researches have been published on short term load forecasting for different load scenarios. Fig. 1 illustrates that, the types of load forecast and its application of short term load forecast for reliable and efficient energy management system. Fig. 1 also depicts that, seasonal load forecast scenario as STLF case studies to analyze the ...
- Energy forecasting in smart grid systems: recent advancements in probabilistic deep learning — Figure 2 shows the pattern of publications for last two decades within 5 year duration with respect to different time horizons in energy systems forecasting. While LTF stands second in line, most number of publications are made for STF in the period 2016-2021, making it most widely utilized forecasting category in recent times for different applications in grid planning, operations, and ...
- Short-Term Electric Load Forecasting Using ESN Neural Networks - Springer — Recurrent neural networks for short-term load forecasting. SpringerBriefs in Computer Science. Book Google Scholar Deihimi, A., & Showkati, H. (2012). Application of echo state networks in short-term electric load forecasting. Energy, Elsevier, 39(1), 327-340. Google Scholar
- Energy Forecasting and Decision Making using Data Analytics in Smart Grid — In a world driven by a massive demand for energy, energy forecasting and intelligent decision making are crucial. Load forecasting remains challenging due to the non-linearity, multiple ...
- PDF Smart Power Grids 2011 - download.e-bookshelf.de — We focus on the grid integration of renewable energy because it is a driver for a major infrastructure modernization such as power electronics, control, sensor technology, computer technology, and communication systems known as "smart grid". In each chapter, the contributing authors present a number of important areas of smart power grids.
- Power Systems Signal Processing for Smart Grids | Wiley — With special relation to smart grids, this book provides clear and comprehensive explanation of how Digital Signal Processing (DSP) and Computational Intelligence (CI) techniques can be applied to solve problems in the power system. Its unique coverage bridges the gap between DSP, electrical power and energy engineering systems, showing many different techniques applied to typical and expected ...
- PDF Renewable and Sustainable Energy Reviews - ResearchGate — Smart grid (SG) abstract Electrical load forecasting plays a vital role in order to achieve the concept of next generation power system such as smart grid, efficient energy management and better ...
- PDF Energy Management Algorithms in Smart Grids State of The Art and ... — Smart grids, Energy management, Renewable resources, Storage systems, Multi-agent systems 1. INTRODUCTION There is a growing worldwide interest in the evolution of the smart grid [1], a modern ...
7.3 Online Resources and Tutorials
- Energy forecasting in smart grid systems: recent advancements in probabilistic deep learning — Figure 2 shows the pattern of publications for last two decades within 5 year duration with respect to different time horizons in energy systems forecasting. While LTF stands second in line, most number of publications are made for STF in the period 2016-2021, making it most widely utilized forecasting category in recent times for different applications in grid planning, operations, and ...
- Short-term load forecasting based on LSTNet in power system — Accurate short-term power load forecasting is very important in power grid decision-making operations and users power management. However, due to the nonlinear and random behavior of users, the electrical load curve is a complex signal.
- PDF What Is Subsynchronous Resonance - sq2.scholarpedia — introduction 169 7 2 static var compensator 171 7 3 torsional interactions with svc 186 7 4 static condenser statcon 189 7 5 ... energy grid integration system but also examining different strategies for analysis such as frequency domain based and state space ... all technologies and tools approached in this book are essential for power system ...
- Posit | The Open-Source Data Science Company — Posit Connect Cloud Quickly publish and share Python and R work, like apps, reports, and documents Posit Cloud Code in RStudio or Jupyter Notebooks, and easily share your projects Public Package Manager Discover and install Python and R packages from CRAN, PyPI, and Bioconductor with date-based snapshots SHINYAPPS.IO Share your Shiny applications online in minutes
- Wiring Diagram in Solar PV System - IAMMETER — To-grid energy (exported to the grid) From-grid energy (imported from the grid) Direct self-use energy; We'll present the wiring diagrams for installing WiFi energy meters in solar PV systems. 2. Single Phase Solar PV System. For monitoring your single-phase solar PV system, you have two options to achieve this: Install 2 single-phase WiFi ...
- PDF EnergyStrategyReviews - ResearchGate — Distributed energy generations and smart grids for sustainable SCs Power plants are usually located at remote areas which cause line losses while transmitting power to the city.
- Deep Learning — The Deep Learning textbook is a resource intended to help students and practitioners enter the field of machine learning in general and deep learning in particular. The online version of the book is now complete and will remain available online for free. The deep learning textbook can now be ordered on Amazon.
- TechDocs — Integrates and automates tools and processes for developers and IT ops across the app lifecycle, on both Cloud Foundry and Kubernetes
- Oracle Help Center — Getting started guides, documentation, tutorials, architectures, and more content for Oracle products and services.
- PDF Chapter 7 Case Studies - Springer — Chapter 7 Case Studies 7.1 Introduction The present chapter provides brief information about representative case studies related to Machine Learning, Fuzzy Inference Systems, Neuro-Fuzzy Inference