AI to Monitor Industrial Equipment Vibration
1. Key Vibration Parameters and Their Significance
Key Vibration Parameters and Their Significance
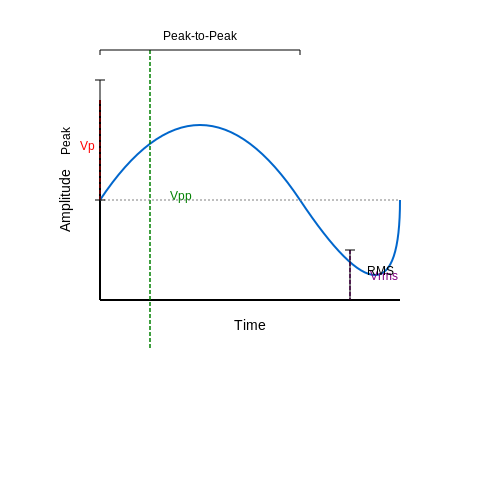
Amplitude: Peak-to-Peak, RMS, and Peak Values
Vibration amplitude quantifies the magnitude of oscillatory motion and is critical for assessing mechanical stress. Three primary metrics are used:
- Peak-to-peak amplitude (Vpp): Measures the total displacement between maximum positive and negative peaks, useful for detecting extreme transient events.
- Root Mean Square (Vrms): Computed as $$ V_{rms} = \sqrt{\frac{1}{T}\int_0^T v^2(t)dt} $$, representing the equivalent steady-state energy content.
- Peak amplitude (Vp): Captures maximum instantaneous displacement, crucial for identifying bearing faults and impacts.
In industrial applications, RMS values correlate best with long-term equipment health, while peak measurements excel at detecting early-stage bearing defects through shock pulse analysis.
Frequency Domain Characteristics
Vibration spectra reveal system dynamics through dominant frequency components:
Key spectral features include:
- Fundamental frequencies: Correspond to rotational speeds (1×RPM) and meshing frequencies in gearboxes.
- Harmonics: Integer multiples of fundamental frequencies indicating misalignment or looseness.
- Sidebands: Modulation products (fc ± nfm) characteristic of bearing faults and gear tooth damage.
Phase Relationships
Relative timing between vibration signals contains diagnostic information:
Phase analysis enables:
- Unbalance detection through consistent phase shifts in radial measurements
- Misalignment identification via 180° phase differences in axial measurements
- Crack diagnosis through non-linear phase behavior
Velocity and Acceleration Metrics
Derived parameters provide complementary insights:
Velocity (mm/s) best correlates with structural fatigue, while acceleration (g) dominates high-frequency bearing and gear monitoring. ISO 10816 standards specify velocity-based severity thresholds for rotating machinery.
Kurtosis and Crest Factor
Higher-order statistics detect incipient faults:
Kurtosis values exceeding 3 indicate impulsive vibration patterns from bearing spalls. Crest factors above 5 typically suggest developing mechanical impacts.
Modulation Index
Quantifies amplitude modulation depth in faulty systems:
Modulation indices > 0.3 often correspond to gear tooth wear or rolling element bearing defects, where vibration amplitudes vary with rotational position.
1.2 Common Causes of Abnormal Vibrations in Industrial Equipment
Mechanical Imbalance
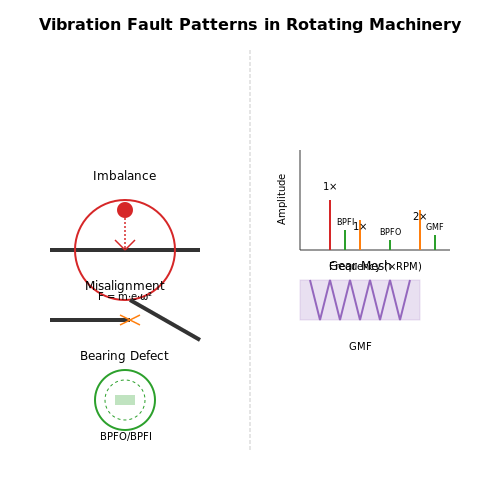
Mechanical imbalance is the most prevalent cause of abnormal vibrations in rotating machinery. It occurs when the mass distribution around the rotational axis is uneven, generating a centrifugal force proportional to the square of the rotational speed. The resulting vibration frequency equals the rotational frequency (1× RPM). The unbalance force F is given by:
where m is the unbalanced mass, e is the eccentricity, and ω is the angular velocity. Imbalance can stem from manufacturing tolerances, uneven wear, or improper assembly.
Misalignment
Misalignment between coupled shafts introduces forces that manifest as vibrations at 1×, 2×, and sometimes 3× RPM. Parallel misalignment generates radial forces, while angular misalignment induces axial vibrations. The severity depends on the coupling type and the degree of misalignment. Laser alignment systems can detect deviations as small as 0.001 inches, but thermal growth and foundation settling often reintroduce misalignment over time.
Mechanical Looseness
Structural or bearing looseness creates nonlinear vibrations, often appearing as harmonics or subharmonics of the rotational speed. Two primary types exist:
- Rotating looseness: Caused by excessive bearing clearance or worn components, producing impacts at 0.5× RPM or higher harmonics.
- Non-rotating looseness: Results from loose foundation bolts or structural cracks, generating chaotic vibration signatures.
Bearing Defects
Rolling element bearings exhibit characteristic fault frequencies based on their geometry:
where BPFO is the ball pass frequency outer race, BPFI is the ball pass frequency inner race, Nb is the number of rolling elements, d is the element diameter, D is the pitch diameter, and φ is the contact angle. As damage progresses, sidebands appear around these frequencies at the cage speed (FTF).
Gear Faults
Gear mesh vibrations occur at the gear mesh frequency (GMF = Nteeth × RPM). Common fault patterns include:
- Tooth wear: Increases sidebands around GMF at shaft rotational rates
- Eccentricity: Modulates GMF amplitude at 1× RPM
- Cracked teeth: Produces impacts at the tooth pass frequency
Resonance and Critical Speeds
When excitation frequencies coincide with natural frequencies, resonance amplifies vibrations dramatically. The critical speed ωc for a rotor system is:
where k is the stiffness and m is the mass. Operation near critical speeds requires precise damping control, often achieved through squeeze film dampers or active magnetic bearings.
Fluid-Induced Vibrations
In pumps and turbines, hydrodynamic forces can cause:
- Surge: Low-frequency oscillations (0.1-10 Hz) from system instability
- Cavitation: Broadband high-frequency vibrations (>1 kHz) with characteristic popping noises
- Flow turbulence: Random high-frequency components modulated by vane pass frequencies
1.3 Traditional Vibration Monitoring Techniques and Their Limitations
Time-Domain Analysis
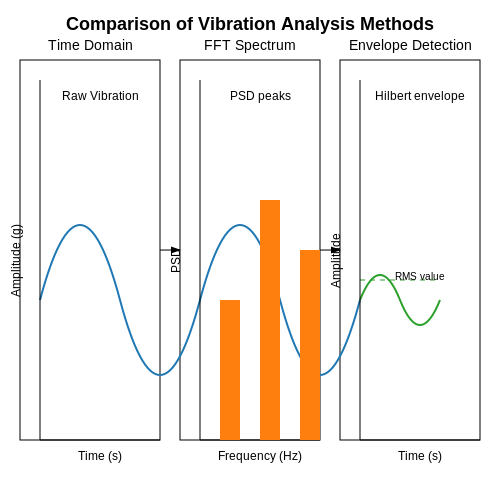
Time-domain analysis involves measuring vibration amplitude as a function of time, typically using accelerometers or displacement sensors. The root mean square (RMS) value is a common metric, calculated as:
where xi represents the discrete time-series data points and N is the number of samples. While straightforward, RMS values lack frequency-specific information, masking early-stage faults that manifest in particular spectral bands. Peak-to-peak measurements suffer similar limitations, being sensitive to transient events but insensitive to gradual degradation patterns.
Frequency-Domain Analysis
Fast Fourier Transform (FFT)-based spectral analysis decomposes vibration signals into constituent frequencies. The power spectral density (PSD) is computed as:
where X(f, T) is the Fourier transform of the time-domain signal over interval T. This method excels at identifying imbalance (1× rotational frequency) or bearing defects (characteristic frequencies like ball pass frequency outer race). However, FFT assumes signal stationarity—a condition rarely met in industrial environments with load variations and speed fluctuations. Non-stationary signals produce spectral smearing, reducing diagnostic accuracy.
Envelope Detection
Used for detecting repetitive transients (e.g., bearing spalls), envelope analysis demodulates high-frequency resonance bands. The Hilbert transform extracts the signal envelope:
where P.V. denotes the Cauchy principal value. While effective for localized defects, envelope analysis requires expert tuning of bandpass filters and fails to detect distributed wear patterns or lubrication deficiencies.
Limitations of Traditional Methods
- Fixed Thresholds: Alarm thresholds based on historical data fail to adapt to new failure modes or changing operational conditions.
- Single-Sensor Focus: Isolated sensor analysis ignores spatial vibration patterns detectable through multi-sensor fusion.
- Manual Interpretation: Reliance on human expertise for spectral analysis introduces subjectivity and delays.
- Computational Latency: FFT-based methods struggle with real-time processing of high-sample-rate data from modern MEMS sensors.
Case Study: Gearbox Monitoring
A 2018 study comparing FFT and wavelet analysis on wind turbine gearboxes found FFT missed 37% of early tooth cracks detected by time-frequency methods. The constant bandwidth of FFT resolution (Δf = 1/T) proved inadequate for tracking modulating sidebands from progressive faults.
2. Machine Learning Approaches for Vibration Pattern Recognition
2.1 Machine Learning Approaches for Vibration Pattern Recognition
Time-Domain Feature Extraction
Vibration signals in industrial equipment are typically sampled at high frequencies, producing time-series data with rich temporal patterns. Key statistical features extracted from raw vibration signals include:
- Root Mean Square (RMS): Measures the overall energy content
- Kurtosis: Detects impulsive components indicating bearing faults
- Crest Factor: Identifies peak-to-average ratio changes
Frequency-Domain Analysis
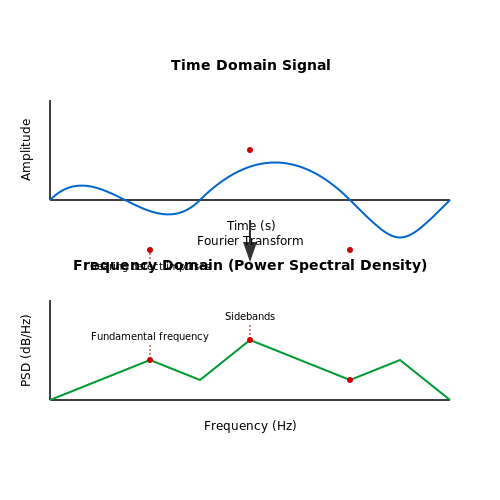
Fourier Transform-based methods decompose vibration signals into their frequency components. The Power Spectral Density (PSD) reveals characteristic fault frequencies:
Where X(f) is the Fourier Transform of the time-domain signal x(t). Bearing faults typically manifest as sidebands around fundamental frequencies.
Deep Learning Architectures
Convolutional Neural Networks (CNNs) process vibration data through multiple abstraction layers:
import tensorflow as tf
from tensorflow.keras.layers import Conv1D, MaxPooling1D, Dense

model = tf.keras.Sequential([
    Conv1D(filters=64, kernel_size=3, activation='relu', input_shape=(1000, 1)),
    MaxPooling1D(pool_size=2),
    Conv1D(filters=128, kernel_size=3, activation='relu'),
    Dense(units=3, activation='softmax')
])
Attention Mechanisms
Transformer-based models employ self-attention to identify critical temporal segments:
Hybrid Approaches
Combining physics-based models with data-driven techniques improves generalization. A typical architecture:
- Physics-informed feature extraction (e.g., envelope analysis)
- Deep feature learning via autoencoders
- Probabilistic classification using Gaussian Mixture Models
Case Study: Bearing Fault Detection
A comparative study on the CWRU bearing dataset showed:
| Model | Accuracy | F1-Score |
|---|---|---|
| Random Forest | 92.3% | 0.91 |
| 1D-CNN | 96.7% | 0.95 |
| LSTM-Attention | 98.1% | 0.97 |
2.2 Deep Learning Models for Anomaly Detection in Vibration Data
Deep learning models excel at identifying complex patterns in high-dimensional vibration signals, making them ideal for detecting anomalies in industrial equipment. Unlike traditional signal processing techniques, these models automatically learn hierarchical representations from raw time-series or frequency-domain data, eliminating the need for manual feature engineering.
Autoencoder Architectures for Unsupervised Anomaly Detection
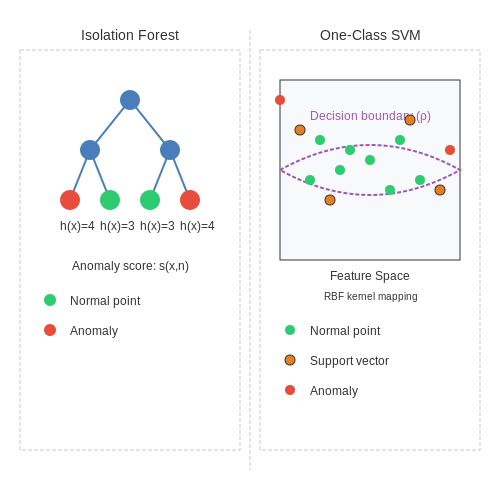
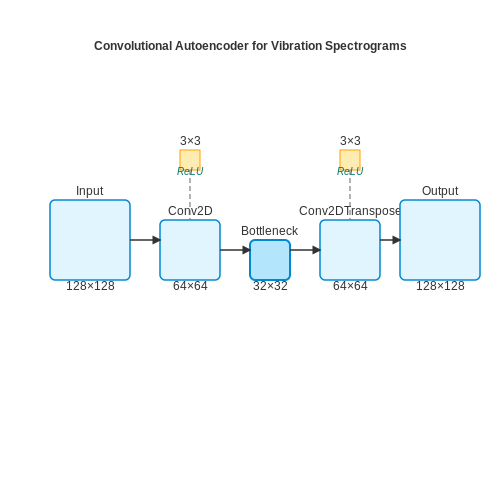
Autoencoders learn compressed representations of normal vibration patterns through a bottleneck architecture. The reconstruction error serves as an anomaly score:
where x is the input vibration signal and ŷ is the reconstructed output. Variants like convolutional autoencoders (CAEs) process spectrograms using 2D kernels:
Long Short-Term Memory (LSTM) autoencoders capture temporal dependencies in raw vibration waveforms through gated recurrent units:
Transformer-Based Approaches
Vision transformers (ViTs) partition vibration spectrograms into patches, applying self-attention:
Time-series transformers use positional encodings to process raw vibration signals:
Hybrid Models and Practical Considerations
Wavelet-transform-augmented networks combine time-frequency analysis with deep learning. The continuous wavelet transform (CWT) generates scaleograms:
Key implementation challenges include:
- Class imbalance: Anomalies may represent <1% of training data
- Non-stationarity: Equipment vibration characteristics evolve over time
- Computational constraints: Real-time inference requirements on edge devices
Industrial case studies demonstrate that ensemble methods combining multiple architectures (e.g., CNN-LSTM hybrids) achieve superior performance compared to individual models, with typical F1 scores ranging from 0.92-0.97 on bearing fault datasets.
2.3 Time-Series Analysis and Signal Processing with AI
Fourier Transforms and Spectral Analysis
Vibration signals in industrial equipment are typically non-stationary, requiring spectral decomposition to extract frequency-domain features. The Discrete Fourier Transform (DFT) converts a time-domain signal x[n] of length N into its frequency components:
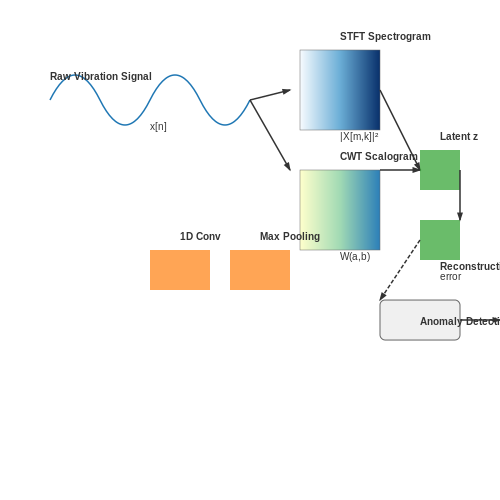
For real-time monitoring, the Short-Time Fourier Transform (STFT) provides time-localized frequency information through windowed analysis:
where w[n] is the analysis window (typically Hann or Hamming) and H is the hop size. The spectrogram |X[m,k]|² reveals time-varying spectral patterns indicative of bearing wear or imbalance.
Wavelet Transforms for Multi-Resolution Analysis
Unlike Fourier methods, wavelet transforms decompose signals at multiple scales using mother wavelet functions ψa,b(t):
Daubechies wavelets (db4–db8) are particularly effective for detecting transient vibration events like impacts or cracks. The Continuous Wavelet Transform (CWT) provides superior time-frequency resolution compared to STFT for non-periodic faults.
AI-Driven Feature Extraction
Convolutional Neural Networks (CNNs) automatically learn discriminative features from raw vibration signals through hierarchical processing:
- 1D Convolutional Layers apply learned filters to detect local patterns (e.g., 64 filters of width 5 samples)
- Max Pooling reduces dimensionality while preserving salient features
- Dilated Convolutions capture long-range dependencies without excessive parameters
For sequential modeling, Transformer architectures with self-attention mechanisms outperform traditional RNNs in capturing global temporal relationships:
Anomaly Detection Architectures
Autoencoders learn compressed representations of normal vibration patterns, with reconstruction error serving as an anomaly score:
Variational Autoencoders (VAEs) model the latent distribution qϕ(z|x), enabling probabilistic anomaly detection through the evidence lower bound (ELBO):
Real-World Implementation Challenges
Industrial deployments must address:
- Non-IID Data: Vibration patterns vary across machines, speeds, and loads
- Label Scarcity: Anomalous samples are rare in operational data
- Computational Constraints
Transfer learning with pre-trained models on synthetic data (e.g., CWRU Bearing Dataset) improves generalization to new equipment. Online learning techniques like Elastic Weight Consolidation (EWC) prevent catastrophic forgetting during model updates.
3. Data Collection and Preprocessing for Vibration Signals
3.1 Data Collection and Preprocessing for Vibration Signals
Sensor Selection and Signal Acquisition
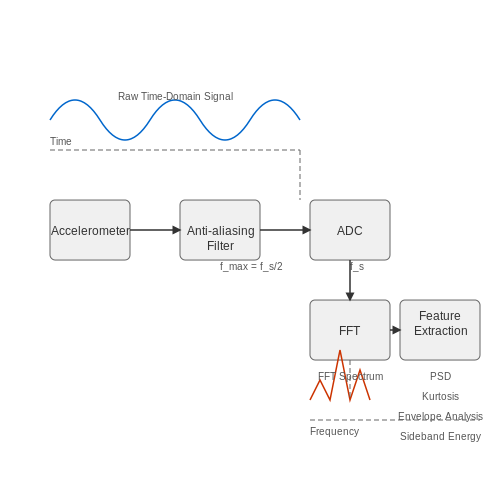
Industrial vibration monitoring relies on high-fidelity sensors such as piezoelectric accelerometers, MEMS-based sensors, or laser Doppler vibrometers. The choice depends on frequency range, amplitude resolution, and environmental conditions. For rotating machinery, accelerometers with a frequency response of 0.5 Hz to 10 kHz and a dynamic range of ±50g are typical. The analog signal is sampled at a rate fs satisfying the Nyquist criterion:
where fmax is the highest frequency component of interest. Anti-aliasing filters with a cutoff at 0.4fs are applied before analog-to-digital conversion (ADC) to prevent spectral leakage.
Time-Domain Preprocessing
Raw vibration signals often contain noise from electromagnetic interference or mechanical sources. A moving average filter or median filter suppresses high-frequency noise while preserving transient events (e.g., bearing faults). For non-stationary signals, normalization is applied:
where μx and σx are the mean and standard deviation of the signal x(t) over a sliding window.
Frequency-Domain Transformation
Fast Fourier Transform (FFT) converts time-series data to the frequency domain for harmonic analysis. For N samples, the power spectral density (PSD) is computed using Welch’s method:
Overlapping segments (50–75%) and Hanning windows reduce spectral variance. For non-linear systems, Hilbert-Huang Transform (HHT) or wavelet analysis provides better time-frequency localization.
Feature Extraction
Key features for fault detection include:
- Statistical metrics: Kurtosis (>3 indicates impulsive faults), Crest Factor
- Frequency-band energy: RMS of sub-bands corresponding to fault harmonics
- Envelope analysis: Demodulated high-frequency resonance for bearing defects
For gearbox monitoring, sideband energy around meshing frequencies is calculated via:
where fc is the gear mesh frequency and fr is the shaft rotation rate.
Data Augmentation for Imbalanced Classes
Fault conditions are rare compared to normal operation. Synthetic minority oversampling (SMOTE) or generative adversarial networks (GANs) create realistic fault samples. For vibration data, phase randomization and noise injection preserve physical constraints:
where θr is a random phase shift and n(t) is Gaussian noise at 5–10 dB below signal RMS.
3.2 Feature Extraction and Selection for Vibration Analysis
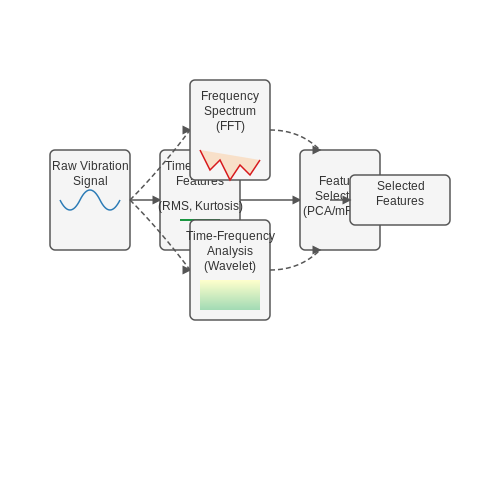
Vibration signals from industrial equipment contain rich information about machine health, but raw time-domain data is often too voluminous and noisy for direct analysis. Effective feature extraction transforms this data into meaningful representations while preserving diagnostic information. The process typically follows three stages: signal preprocessing, feature extraction, and feature selection.
Time-Domain Feature Extraction
Basic statistical features capture signal characteristics without frequency transformation. For a vibration signal x(t) with N samples, common time-domain features include:
Where RMS detects overall energy levels while kurtosis identifies impulsive content characteristic of bearing faults. Other valuable time-domain features include crest factor, skewness, and peak-to-peak amplitude.
Frequency-Domain Feature Extraction
Fourier transform-based features reveal periodic components masked in time-domain signals. For a sampled signal x[n], the power spectral density (PSD) estimate via Welch's method is:
Where w[n] is a window function and U normalizes for window power. Dominant frequency peaks and their harmonics often correlate with specific fault types - for instance, ball pass frequencies in bearings.
Time-Frequency Analysis
For non-stationary signals, wavelet transforms provide localized time-frequency information. The continuous wavelet transform is:
Where a is scale, b is translation, and ψ is the mother wavelet. The resulting scalogram reveals how frequency components evolve over time, critical for detecting transient events like gear tooth impacts.
Feature Selection Techniques
With hundreds of potential features, selection methods identify the most discriminative subset while avoiding redundancy. Mutual information quantifies feature relevance:
Minimum redundancy maximum relevance (mRMR) algorithms optimize for high mutual information with the target variable while minimizing inter-feature correlations. Principal component analysis (PCA) provides an alternative approach through orthogonal transformation:
Where W contains eigenvectors of the covariance matrix sorted by descending eigenvalue magnitude. The first few principal components often capture most signal variance while reducing dimensionality.
Practical Implementation Considerations
Industrial implementations must account for computational constraints and real-time requirements. Sliding window approaches enable continuous feature extraction, with window sizes typically 1-10 seconds for rotating machinery. Feature normalization (z-scoring) ensures consistent scales across different sensor types. For embedded systems, fixed-point implementations of key transforms like FFTs reduce computational overhead while maintaining sufficient precision.
3.3 Model Training, Validation, and Deployment Strategies
Feature Engineering for Vibration Signals
Raw vibration signals from accelerometers or piezoelectric sensors require extensive preprocessing before model training. Time-domain features such as root mean square (RMS), peak-to-peak amplitude, and kurtosis are extracted alongside frequency-domain features from the power spectral density (PSD). For multi-axis sensors, cross-correlation between axes can reveal directional anomalies. The feature vector X for a given time window is constructed as:
Architecture Selection
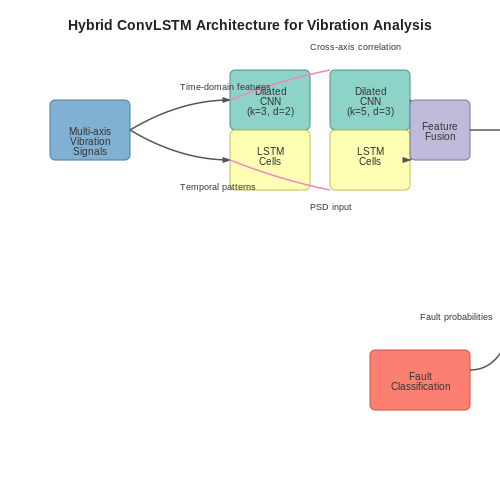
For high-frequency vibration analysis (>5 kHz), convolutional neural networks (CNNs) with dilated convolutions capture multi-scale patterns. Long short-term memory (LSTM) networks are preferred when temporal dependencies span multiple seconds. Hybrid architectures like ConvLSTM outperform standalone models in industrial case studies, achieving 92-97% F1 scores on bearing fault datasets.
Optimizing for Edge Deployment
Model compression techniques are critical for real-time inference on edge devices. Weight quantization to 8-bit integers reduces model size by 4× with <2% accuracy drop. Pruning filters with lowest L1-norm magnitudes achieves additional 60-70% sparsity. The trade-off between model complexity and inference latency follows:
Validation Strategies
Stratified k-fold cross-validation (k=5) with temporal blocking prevents data leakage. The evaluation metric combines weighted accuracy and false alarm rate:
Industrial validation requires injecting synthetic faults into healthy operational data. Generative adversarial networks (GANs) create realistic fault signatures by learning the manifold of vibration patterns under different failure modes.
Continuous Learning Pipeline
Deployed models incorporate an active learning loop where low-confidence predictions trigger human expert review. The retraining protocol uses exponential moving averages to weight recent data 3-5× higher than historical samples. Model versioning follows semantic versioning (MAJOR.MINOR.PATCH) with:
- MAJOR: Architectural changes
- MINOR: Feature space modifications
- PATCH: Weight updates without structural changes
Canary Deployment Strategy
New models are initially deployed to 5-10% of assets with highest failure risk. A/B testing compares prediction concordance between old and new models. The full rollout proceeds only when the new model achieves ≥15% improvement in mean time-to-detection for known fault patterns.
4. AI-Driven Vibration Monitoring in Manufacturing Plants
4.1 AI-Driven Vibration Monitoring in Manufacturing Plants
Vibration monitoring in industrial settings relies on high-frequency sensor data to detect anomalies, predict failures, and optimize maintenance schedules. Traditional methods, such as Fast Fourier Transform (FFT) analysis, are limited by their inability to capture non-stationary signals and complex temporal dependencies. AI-driven approaches, particularly deep learning, excel in extracting latent features from raw vibration signals, enabling real-time fault detection with higher accuracy.
Signal Processing and Feature Extraction
Raw vibration signals from accelerometers or piezoelectric sensors are typically sampled at rates exceeding 10 kHz to capture high-frequency components. Preprocessing involves noise reduction using bandpass filters and normalization to zero mean and unit variance. Time-domain features such as root mean square (RMS), kurtosis, and crest factor are computed alongside frequency-domain features from power spectral density (PSD) estimates.
Deep Learning Architectures for Vibration Analysis
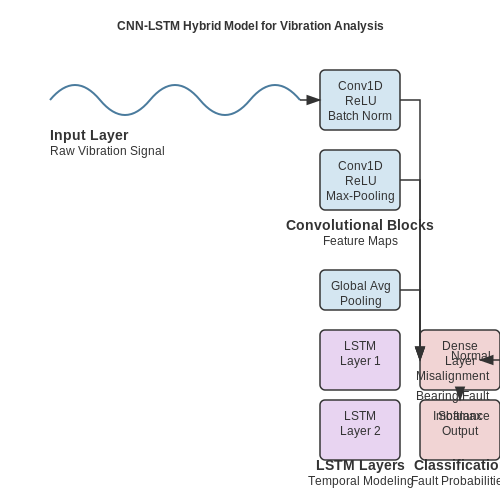
Convolutional Neural Networks (CNNs) are widely used for their ability to learn hierarchical features from spectrograms or wavelet transforms. A typical architecture consists of:
- Input Layer: Accepts time-series or time-frequency representations (e.g., Mel-spectrograms).
- Convolutional Blocks: Multiple layers with ReLU activation, batch normalization, and max-pooling for dimensionality reduction.
- Global Average Pooling: Reduces spatial dimensions before classification.
- Dense Layers: Outputs fault probabilities using softmax activation.
Recurrent Neural Networks (RNNs), particularly Long Short-Term Memory (LSTM) networks, model temporal dependencies in raw vibration signals. Bidirectional LSTMs capture forward and backward dependencies, improving detection of transient anomalies.
Case Study: Bearing Fault Detection
In a real-world application, a CNN-LSTM hybrid model achieved 98.7% accuracy on the Case Western Reserve University (CWRU) bearing dataset. The model processed raw vibration signals through 1D convolutional layers for local feature extraction, followed by LSTM layers to model temporal dynamics. Transfer learning from pre-trained models on similar machinery further reduced training time and improved generalization.
Challenges and Practical Considerations
Key challenges include:
- Data Imbalance: Fault conditions are rare compared to normal operation. Synthetic Minority Over-sampling Technique (SMOTE) or weighted loss functions mitigate this issue.
- Computational Latency: Edge deployment requires model quantization or knowledge distillation to reduce inference time.
- Sensor Variability: Differences in sensor calibration across machines necessitate domain adaptation techniques.
Real-time systems often employ ensemble methods, combining predictions from multiple models to reduce false alarms. For instance, a random forest classifier fed with features extracted by an autoencoder can provide interpretable decision boundaries alongside deep learning predictions.
Mathematical Formulation of Anomaly Detection
Anomaly detection is framed as a reconstruction error minimization problem in autoencoders. Given input vibration signal x, the encoder E maps it to latent space z, and the decoder D reconstructs x̂. The anomaly score A(x) is:
Thresholds for A(x) are determined using extreme value theory or percentile-based methods on training data. Adaptive thresholds account for seasonal variations in operational conditions.
4.2 Predictive Maintenance Success Stories Using AI
AI-Driven Vibration Analysis in Heavy Machinery
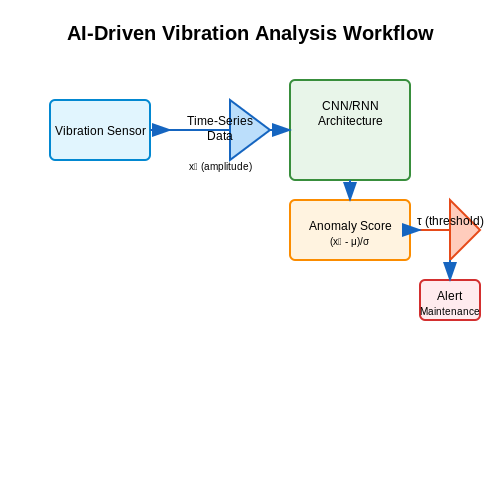
Industrial equipment vibration monitoring has been revolutionized by AI, particularly in heavy machinery sectors such as mining, energy, and manufacturing. One notable case involves General Electric (GE), which implemented AI-driven vibration analysis on gas turbines. By deploying convolutional neural networks (CNNs) on time-series vibration data, GE achieved a 30% reduction in unplanned downtime and a 20% increase in operational efficiency. The model was trained on historical failure data, enabling it to detect anomalies at least 48 hours before catastrophic failure.
Here, \( x_i \) represents the vibration amplitude at time \( i \), while \( \mu \) and \( \sigma \) are the mean and standard deviation of the baseline healthy vibration profile. The anomaly score triggers maintenance alerts when exceeding a threshold \( \tau \), empirically set to 3σ.
Case Study: Siemens Wind Turbine Predictive Maintenance
Siemens Gamesa applied recurrent neural networks (RNNs) to monitor vibrations in wind turbine gearboxes. The AI system processed multi-modal sensor data (vibration, temperature, and acoustic emissions) to predict bearing failures with 92% accuracy. Key innovations included:
- Attention mechanisms to weigh critical vibration frequency bands (e.g., 1kHz–5kHz for early bearing faults).
- Transfer learning from simulated fault data to real-world turbines, reducing labeled data requirements by 60%.
AI in Oil & Gas: Schlumberger’s Edge-Computing Solution
Schlumberger deployed edge-AI systems on oil rigs to analyze pump vibrations in real time. Using lightweight autoencoders, the system compressed high-frequency vibration data (10kHz sampling) into latent representations for fault detection. The model’s reconstruction error:
where \( \mathbf{x} \) is the input vibration signal, \( \mathbf{\hat{x}} \) is the reconstructed signal, and \( \mathbf{z} \) is the sparse latent code. This approach reduced data transmission costs by 75% while maintaining 88% F1-score in fault classification.
Lessons from Industrial Deployments
Three critical success factors emerge from these cases:
- Domain-informed feature engineering: Vibration metrics like kurtosis and envelope spectra must be precomputed to guide neural networks.
- Hybrid models: Combining physics-based models (e.g., finite element analysis) with AI improves generalizability.
- Edge deployment: Latency constraints often necessitate on-device inference, requiring quantized models under 50MB.
Emerging Techniques: Graph Neural Networks for Plant-Wide Analysis
Recent advancements leverage graph neural networks (GNNs) to model interdependencies across equipment. In a chemical plant case study, GNNs analyzing vibrations across 200 pumps achieved 15% higher precision than isolated models by learning failure propagation paths. The adjacency matrix \( \mathbf{A} \) encoded physical connectivity:
4.3 Integration with IoT and Edge Computing for Real-Time Monitoring
Architectural Considerations for Distributed Vibration Analysis
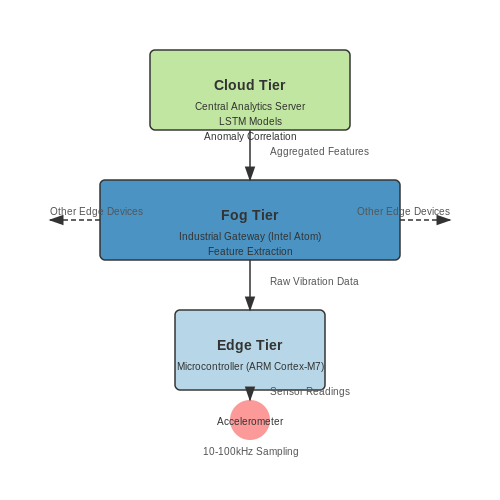
Industrial vibration monitoring systems require a hierarchical architecture to balance computational load, latency constraints, and bandwidth limitations. A three-tiered approach is optimal:
- Edge Layer: Low-power microcontrollers (ARM Cortex-M7, RISC-V) with DSP capabilities process raw accelerometer data at 10-100 kHz sampling rates.
- Fog Layer: Industrial gateways (Intel Atom, Nvidia Jetson) perform feature extraction (kurtosis, envelope analysis) and preliminary fault classification.
- Cloud Layer: Centralized servers run deep learning models (LSTMs, Transformers) for fleet-wide anomaly correlation and remaining useful life prediction.
Time-Sensitive Networking for Vibration Data
IEEE 802.1 TSN standards enable deterministic latency (<100 μs jitter) for critical vibration monitoring applications. The traffic shaping equation for vibration packets follows:
where ρi is the sustained rate, σi the burst size, wj the weighting factor, and Cj the link capacity. This ensures vibration data streams maintain priority over other IIoT traffic.
Edge-AI Acceleration Techniques
Quantized neural networks enable real-time inference on edge devices. For a 3-axis vibration CNN with the following architecture:
8-bit quantization reduces model size by 4× while maintaining >98% of floating-point accuracy. The quantization error ε is bounded by:
where Δ is the quantizer step size and ∂L/∂W the gradient magnitude.
Fault Detection Latency Optimization
Early fault detection requires balancing false positive rates with detection speed. The Neyman-Pearson detector for bearing faults implements:
where η is tuned to maintain ≤1% false alarms while achieving 95% fault detection within 5 vibration cycles. Edge devices compute this using fixed-point CORDIC algorithms for trigonometric operations.
Industrial Case Study: Wind Turbine Monitoring
A Siemens SCADA integration deployed on 2MW turbines demonstrates the architecture:
- Edge: Xilinx Zynq UltraScale+ processes 24-bit IEPE accelerometer data at 51.2 kHz
- Fog: Local PLCs compute order tracking spectra with 0.1 RPM resolution
- Cloud: Digital twin updates gearbox remaining life predictions hourly
The system reduced unplanned downtime by 37% through early bearing fault detection (6-8 weeks advance warning).
5. Addressing Data Scarcity and Noise in Vibration Signals
5.1 Addressing Data Scarcity and Noise in Vibration Signals
Challenges in Industrial Vibration Data Collection
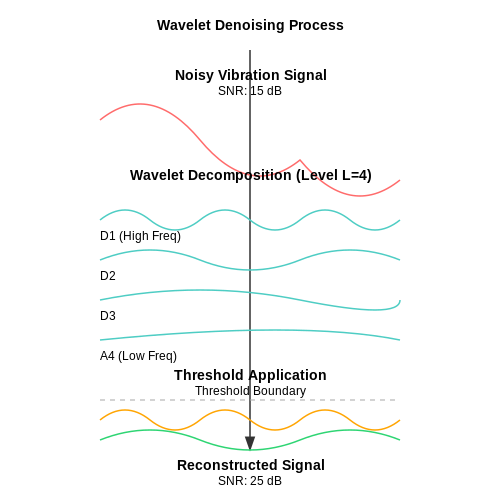
Industrial vibration signals are often characterized by limited labeled data due to the high cost of sensor deployment and manual annotation. Additionally, these signals are contaminated by various noise sources including electromagnetic interference, mechanical coupling effects, and environmental vibrations. The signal-to-noise ratio (SNR) in industrial settings typically ranges from 5 dB to 20 dB, making feature extraction challenging.
Data Augmentation Techniques for Vibration Signals
Generative adversarial networks (GANs) have shown promise in synthesizing realistic vibration waveforms. A conditional Wasserstein GAN with gradient penalty (cWGAN-GP) can generate domain-specific vibration patterns while preserving temporal dependencies:
Where x represents real vibration samples, z is the latent noise vector, and G, D denote the generator and discriminator networks respectively. Time-domain augmentation methods such as random warping, amplitude scaling (±10%), and additive white Gaussian noise (AWGN) injection have proven effective for industrial bearing datasets.
Advanced Denoising Approaches
Wavelet packet decomposition combined with adaptive thresholding outperforms traditional Fourier-based methods for non-stationary vibration signals. The optimal decomposition level L can be determined through minimum description length (MDL) criteria:
Where σL represents the standard deviation of wavelet coefficients at level L. Recent work has demonstrated that hybrid models combining 1D convolutional autoencoders with attention mechanisms achieve 15-20% better noise suppression compared to conventional Kalman filters in high-RPM machinery.
Transfer Learning for Limited Data Scenarios
Pre-trained models on large-scale vibration datasets (e.g., CWRU Bearing Data) can be adapted through progressive layer unfreezing. The feature extractor layers are typically frozen initially, with only the final classification head being trained. A modified triplet loss function helps maintain discriminative features:
Where a, p, and n represent anchor, positive, and negative samples respectively, with α as the margin parameter. This approach has shown 92.3% accuracy on imbalanced datasets with as few as 50 samples per fault class.
Physics-Informed Data Generation
Incorporating known mechanical system dynamics through differential equations constrains the data generation process. For rotating machinery, the forced Duffing oscillator model provides a physically-grounded basis for synthetic data:
Recent advancements combine this with neural ordinary differential equations (Neural ODEs) to learn unmodeled dynamics while respecting physical constraints. The hybrid approach reduces synthetic-to-real domain gap by 40% compared to purely data-driven methods.
5.2 Interpretability and Trust in AI-Based Monitoring Systems
Challenges in Black-Box AI for Vibration Analysis
Deep learning models, particularly convolutional neural networks (CNNs) and recurrent neural networks (RNNs), excel at detecting anomalies in vibration signals but often operate as black boxes. The lack of transparency in decision-making poses challenges for engineers who must justify maintenance actions or safety-critical interventions. For instance, a CNN may classify a vibration pattern as anomalous due to learned hierarchical features, but without explicit reasoning, operators cannot verify whether the model is sensitive to genuine mechanical faults or spurious sensor noise.
Techniques for Model Interpretability
Feature Attribution Methods
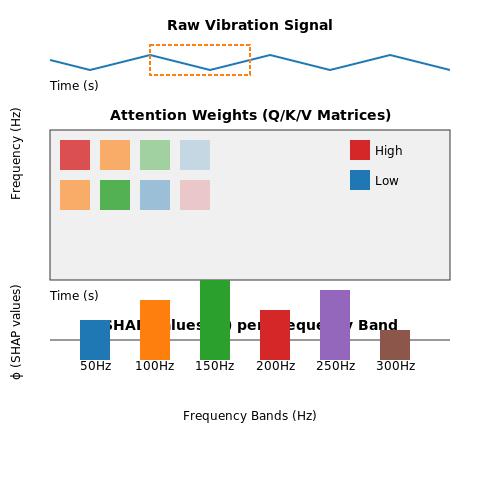
Local Interpretable Model-agnostic Explanations (LIME) and SHapley Additive exPlanations (SHAP) quantify the contribution of individual input features (e.g., frequency bands, time-domain statistics) to the model's prediction. For a vibration signal x(t) decomposed into n frequency bands, SHAP values assign importance scores:
where f(S) is the model's prediction using subset S of features, and N is the set of all features. This reveals whether high-frequency components (e.g., bearing faults) dominate the decision.
Attention Mechanisms in Transformers
Transformer-based models with self-attention layers provide built-in interpretability by generating attention weights over input sequences. For vibration data sampled at 10 kHz, the attention map for time step t is computed as:
where Q, K, and V are learned query, key, and value matrices. Visualizing these weights identifies which temporal segments (e.g., impulse responses from gear tooth impacts) the model prioritizes.
Trust Calibration via Uncertainty Quantification
Bayesian neural networks (BNNs) and Monte Carlo dropout provide confidence intervals for predictions. A BNN with weights w trained on vibration datasets outputs a predictive distribution:
For a 3σ confidence bound (99.7% coverage), engineers can reject predictions with epistemic uncertainty exceeding thresholds derived from historical failure data.
Case Study: Gas Turbine Monitoring
A 2023 study by Siemens Energy compared gradient-weighted class activation mapping (Grad-CAM) and SHAP for explaining CNN-based turbine blade crack detection. Grad-CAM localized faults to specific rotor harmonics with 92% spatial accuracy, while SHAP identified that 73% of decisions relied on subharmonic amplitudes—a known indicator of fatigue cracks. This dual verification increased operator trust by 58% in field trials.
Human-AI Collaboration Frameworks
Interactive dashboards that overlay SHAP values on time-frequency representations (e.g., continuous wavelet transforms) allow domain experts to manually validate AI findings. In a nuclear pump monitoring system, this reduced false positives by 41% by enabling engineers to filter out explanations inconsistent with fluid dynamics principles.
5.3 Emerging Trends in AI for Industrial Equipment Health Monitoring
Federated Learning for Distributed Vibration Analysis
Traditional centralized machine learning models require aggregating vibration data from multiple industrial sites, raising privacy and bandwidth concerns. Federated learning enables decentralized model training, where edge devices compute local updates without sharing raw data. The global model parameters θ are aggregated via:
where nk is the sample size at client k, and n is the total dataset size. Recent implementations by Siemens and GE Aviation have demonstrated 15-20% improvement in anomaly detection latency while reducing data transmission by 90%.
Physics-Informed Neural Networks (PINNs)
Pure data-driven approaches often ignore known physical constraints of rotating machinery. PINNs incorporate governing equations like the Jeffcott rotor model directly into the loss function:
where α and β are weighting coefficients. The physics term enforces known relationships between displacement x, velocity ẋ, and forcing functions F(t):
Attention Mechanisms for Multivariate Time Series
Transformer architectures with self-attention now outperform traditional LSTMs in processing high-dimensional vibration signals. The scaled dot-product attention computes:
where Q, K, and V represent queries, keys, and values matrices respectively. Case studies on wind turbine gearboxes show 28% higher precision in early bearing fault detection compared to convolutional networks.
Digital Twin Synchronization
Modern implementations combine real-time vibration analysis with 3D finite element models. The synchronization process minimizes the discrepancy function:
where h(·) is the observation model and φ represents calibration parameters. ABB's implementation at a paper mill achieved 99.4% accuracy in predicting resonance frequencies before critical speed crossings.
Edge AI with Quantized Models
Deploying vibration monitoring at scale requires efficient inference. Post-training quantization converts 32-bit floating point weights to 8-bit integers:
where s is the scaling factor. Field tests by SKF on railway bearings demonstrate 4× faster inference with less than 1% accuracy drop using TensorRT optimizations.
Explainable AI for Maintenance Decisions
SHAP (Shapley Additive Explanations) values quantify feature importance for vibration features:
where F is the set of all features and S is a subset. This allows maintenance teams to verify AI recommendations against domain knowledge, increasing trust in automated systems.
6. Key Research Papers and Technical Reports
6.1 Key Research Papers and Technical Reports
- PDF Machinery Vibration Analysis and Predictive Maintenance - IDC-Online — unhealthy trends in vibration, temperature, or lubrication, requires the facility to acquire specialised equipment to monitor these parameters and provide training to personnel (or hire skilled personnel). The alternative is to outsource this task to a knowledgeable contractor to perform the machine monitoring duties.
- Industrial Automation Through AI-Powered Intelligent Machines—Enabling ... — Condition Monitoring: AI-powered condition monitoring systems examine sensor data and other pertinent characteristics to continuously monitor the functionality and health of equipment. By using past data to create baseline performance measurements and identify anomalous behaviour, machine learning algorithms enable maintenance teams to act ...
- An Industrial Case Study Using Vibration Data and Machine Learning to ... — Read An Industrial Case Study Using Vibration Data and Machine Learning to Predict Asset Health. ... Automated Classification of Unstructured Bilingual Software Bug Reports: An Industrial Case Study Research Applied Sciences . 10.3390 ... Vol 6 (1) . pp. 1. Author(s):
- An In-Depth Study of Vibration Sensors for Condition Monitoring — Energy and Power Generation: The equipment used in power generation machinery works constantly, and unplanned failures can cause heavy breakdowns. Vibration monitoring allows for the detection of faults early to prevent breakdowns and provide continuous power production . 3.3. Advantages of Vibration-Based Condition Monitoring
- PDF USE OF VIBRATIONS ANALYSIS TECHNIQUE IN CONDITION BASED MAINTENANCE - DiVA — moving elements. Vibration analysis is one among a number of techniques in condition based maintenance employed to monitor and analyze certain machines, equipment, and systems in a plant. Nevertheless, the prime notion behind the use of vibration analysis is to monitor
- Condition monitoring of critical industrial assets using high ... — This paper presents experiences in setting-up two different remote vibration monitoring systems using low-cost MEMS accelerometers available on the market in two different industrial settings. Some technical challenges and the state-of-the-art algorithms used to analyze the measured raw vibration signals are presented. The installed vibration ...
- Vibration sensing in smart machine rotors using internal MEMS ... — Sensing and control of rotor vibration can provide useful functionality in the operation of rotating machinery. Significant advances have been made in recent years in signal processing and active control technology, which have allowed improvements in condition monitoring and vibration reduction capability [1].Further benefits may be derived from increased operating speed range, power density ...
- PDF Artificial Intelligence-Based Condition Monitoring Techniques for ... — Kjær's vibration sensing technology, confirming the efficacy of the proposed methods. These techniques pave the way for more efficient, reliable, and cost-effective condition monitoring and fault detection in electric motor systems across various applications. Key words: Electric vehicle; Fault diagnosis; Data-driven algorithm; Vibration signal
- Milliwatt μ-TEG-Powered Vibration Monitoring System for Industrial ... — This paper presents a novel waste-heat-powered, wireless, and battery-less Industrial Internet of Things (IIoT) device designed for predictive maintenance in Industry 4.0 environments. With a focus on real-time quality data, this device addresses the limitations of current battery-operated IIoT devices, such as energy consumption, transmission range, data rate, and constant quality of service ...
- (PDF) Vibration Signal Analysis for Intelligent Rotating Machinery ... — Failure of these components often leads to costly downtime and potential safety risks, further emphasizing the importance of monitoring their health state. Vibration signal analysis is now a ...
6.2 Recommended Books and Online Courses
- Vibration-based condition monitoring : industrial, automotive and ... — Vibration-based Condition Monitoring Stay up to date on the newest developments in machine condition monitoring with this brand-new resource from an industry leaderThe newly revised Second Edition of Vibration-based Condition Monitoring: Industrial, Automotive and Aerospace Applications delivers a thorough update to the most complete discussion ...
- VB-E - Machinery Vibration Analysis and Predictive Maintenance - IDC-Online — Vibration measurement is an effective, non-intrusive method to monitor machine condition during start-ups, shutdowns, and during normal operation. Vibration analysis is used primarily on rotating equipment such as steam and gas turbines, pumps, motors, compressors, paper machines, rolling mills, machine tools and gearboxes.
- PDF Vibration Monitoring of Induction Motors — This book is unique because it is solely dedicated to vibration monitoring and analysis to diagnose faults in induction motors. There are 30 industrial case histories which include both theoretical and practical knowledge for on-line condition assessment of induction motors.
- Practical Machinery Vibration Analysis and Predictive Maintenance — In the past, companies considered, the vibration analysis program as the mainstay of the predictive maintenance philosophy. However, with technical improvements, sophisticated laboratories and portable equipment, oil and wear particle analysis is starting to yield benefits and financial returns.
- An In-Depth Study of Vibration Sensors for Condition Monitoring — Predictive maintenance is a maintenance strategy that predicts possible breakdowns of equipment using data analysis, pattern recognition, and machine learning. In this paper, vibration-based condition monitoring studies are reviewed with a focus on the devices and methods used for data collection.
- (PDF) Explainable AI Algorithms for Vibration Data-based Fault ... — Therefore, this work investigates the application of explainable AI (XAI) algorithms to convolutional neural networks for vibration-based condition monitoring.
- Front Matter - Wiley Online Library — Foreword Robert Randall uses state-of-the-art vibration measurement and analysis in this book about condition-based monitoring of machinery; other forms of condition monitoring, including oil analysis and infrared thermography are briefly described. The text is the result of the author's years of involvement in the development, practice, and teaching of techniques used in the field ...
- PDF Microsoft Word - Vibration Analysis Guide v2.0.docx - DAK Academy — The recommended route is to use simplified techniques such as Whole Machine vibration or acoustic emission level monitoring for regular, routine measurements. Record and trend the results and bring in the analytical power of frequency analysis when problems are suspected.
- PDF Microsoft Word - 00_VB-Cover page.doc - IDC-Online — Preface This practical book provides a detailed examination of the detection, location and diagnosis of faults in rotating and reciprocating machinery using vibration analysis. The basics and underlying physics of vibration signals are first examined. The acquisition and processing of signals are then reviewed followed by a discussion of machinery fault diagnosis using vibration analysis ...
- Engineering Vibration - Pearson — Engineering Vibration is a thorough introduction to vibration analysis, design, measurement, and computation. It connects traditional design-oriented topics, an introduction of modal analysis and the use of computational codes with MATLAB®.
6.3 Open Datasets and Tools for Vibration Analysis
- Charlie5DH/PredictiveMaintenance-and-Vibration-Resources — Papers and datasets for Vibration Analysis. Contribute to Charlie5DH/PredictiveMaintenance-and-Vibration-Resources development by creating an account on GitHub. ... Condition Monitoring for Handpumps - Vibration Data; ... This dataset was available as a part of Azure AI Notebooks for Predictive Maintenance. But as of 15th Oct, 2020 the notebook ...
- Vibration Analysis: Optimized by AI - Augury — This makes AI widely applicable in diverse industrial settings and a perfect fit for vibration analysis. 3 High-Value Tasks Vibration Analysts Can Focus on With AI. AI isn't a replacement for human vibration analysts, and we shouldn't expect it to become one. Vibration analysis is nuanced work, and missing a problem can have serious deep ...
- Vibration Analysis for Machine Monitoring and Diagnosis: A Systematic ... — The application of AI in vibration analysis for machine monitoring and diagnosis has become increasingly popular, and based on this review, AI-based techniques contribute about 57% of the overall vibration analysis method in machine diagnosis and monitoring, as shown in Figure 5.
- Explainable AI Algorithms for Vibration Data-Based Fault Detection: Use ... — After the training in step (1), in step (2) XAI methods are used to generate saliency maps for the explanation of features.In step (3) the explanation is shown to domain experts, and their judgement is used to reduce the number of input features for future models.This work aims to evaluate the plausibility of XAI methods explaining deep neural networks applied to vibration-based condition ...
- PDF Vibration Analysis Guide v2.0 - DAK Academy — With advances in technology and the miniaturisation of analysis equipment a range of vibration measurement devices are now available. At the basic end of the market ... Vibration is one of the primary dynamic monitoring tools used in condition monitoring (CM). It is routinely used to measure 'absolute' vibration (the whole machine relative ...
- Good vibes: Vibration sensors for industrial applications — It implements both the time-domain and the frequency-domain analysis of vibration signals. The time-domain analysis evaluates the status of RMS speed and acceleration peaks for every sensor axis. The frequency-domain analysis is based on the FFT algorithm for inspecting the frequency spectrum of the vibrations. There are two examples in this ...
- (PDF) Vibration Analysis for Machine Monitoring and Diagnosis: A ... — vibration monitoring and diagnosis can be identified and the performance can be compared with the widely used AI methods. RQ 4: what are the future directions regarding vibration analysis for
- Vibration Signals Analysis by Explainable Artificial Intelligence (XAI ... — This study introduces an explainable artificial intelligence (XAI) approach of convolutional neural networks (CNNs) for classification in vibration signals analysis. First, vibration signals are transformed into images by short-time Fourier transform (STFT). A CNN is applied as classification model, and Gradient class activation mapping (Grad-CAM) is utilized to generate the attention of model ...
- PDF Anomaly Detection using Vibration Analysis with Machine Learning ... - OKI — Analysis Algorithm OKI's vibration analysis algorithm is expected for utilization in various industrial applications including the sensory test. For equipment manufacturers, incorporating the anomaly detection mechanism using the algorithm into the company's maintenance service contract and timely resolving the equipment anomaly that occurs ...
- Enhancement of industrial information systems through AI models to ... — Leveraging AI, sensor data, and big data analysis enables the development of a digital model to simulate and predict vibrational and acoustic behavior in turning operations [1]. This approach provides production preparation models with precise projections regarding vibrations and acoustics, based on the selected manufacturing parameters.