Using Transformers with Structured Data
1. Overview of Transformer Architectures
Overview of Transformer Architectures
The transformer architecture, introduced by Vaswani et al. in 2017, revolutionized sequence modeling by replacing recurrent and convolutional layers with self-attention mechanisms. Unlike traditional architectures, transformers process entire sequences in parallel, enabling efficient training on large-scale datasets while capturing long-range dependencies.
Core Components
The transformer consists of two primary modules: the encoder and decoder, each composed of stacked layers. The encoder maps an input sequence to a continuous representation, while the decoder generates an output sequence autoregressively. Both employ:
- Multi-Head Attention: Computes attention weights across all positions in parallel, allowing the model to focus on different parts of the input simultaneously.
- Position-wise Feed-Forward Networks: Applies identical fully connected layers to each position, enabling non-linear transformations.
- Layer Normalization and Residual Connections: Stabilizes training by normalizing layer inputs and adding skip connections.
Self-Attention Mechanism
The self-attention mechanism computes a weighted sum of values V, where weights are derived from queries Q and keys K. For a single head, the output is:
Here, dk is the dimension of the keys, and the scaling factor √dk prevents gradient saturation. Multi-head attention extends this by concatenating outputs from h independent heads:
where each headi is computed using separate learned projections WiQ, WiK, WiV.
Positional Encoding
Since transformers lack inherent sequential processing, positional encodings inject information about token order. The original paper uses sinusoidal functions:
where pos is the position and i is the dimension. This allows the model to generalize to unseen sequence lengths.
Applications to Structured Data
Transformers adapt to structured data (e.g., tables, graphs) through:
- Tokenization: Flattening rows/columns into sequences or using hierarchical embeddings.
- Attention Masking: Restricting attention to valid relations (e.g., table cells within the same row).
- Graph Transformers: Extending attention to edges in graph structures.
Recent variants like TabTransformer and GraphGPS demonstrate state-of-the-art performance on structured data tasks by combining attention with domain-specific inductive biases.
Challenges of Applying Transformers to Structured Data
1. Lack of Natural Sequential Order
Unlike text or time-series data, structured data (e.g., tabular datasets) lacks an inherent sequential order. Transformers rely on positional encodings to capture sequence information, but this becomes ambiguous when rows or columns in a table have no meaningful ordering. For instance, shuffling rows in a dataset should not alter its semantics, yet standard positional embeddings inject artificial sequence dependencies.
These sinusoidal positional encodings assume a fixed step size between positions, which is ill-suited for heterogeneous tabular features where distances between columns are non-uniform.
2. High Computational Complexity
Transformers scale quadratically with input length due to self-attention mechanisms. For a table with n rows and m columns, the attention matrix grows as O(n²m²), making it impractical for large datasets. Sparse attention or patching techniques (e.g., reformulating tables as grids) introduce trade-offs between granularity and efficiency.
3. Heterogeneous Data Types
Structured data mixes numerical, categorical, and ordinal features, each requiring distinct embedding strategies. While numerical values can be projected directly, categorical variables demand learned embeddings or tokenization. This heterogeneity complicates the design of a unified transformer architecture. For example:
- Numerical features: Linear projection or scaling.
- Categorical features: Embedding layers with vocabulary-size-dependent dimensions.
- Missing values: Require special masking or imputation tokens.
4. Limited Inductive Biases
Transformers lack built-in inductive biases for relational priors (e.g., foreign-key relationships in databases) or hierarchical structures (e.g., nested JSON). Convolutional or graph-based networks inherently capture local or relational patterns, whereas transformers must learn these from scratch, demanding larger datasets.
5. Feature Interaction Modeling
While self-attention can theoretically model arbitrary feature interactions, in practice, it struggles with sparse high-order dependencies common in structured data (e.g., "IF age > 60 AND cholesterol > 240 THEN risk=high"). Explicit cross-feature attention mechanisms or auxiliary loss functions are often needed to surface such logic.
Case Study: Retail Transaction Tables
A transformer applied to retail data must simultaneously handle:
- Product IDs (high-cardinality categorical).
- Transaction timestamps (sequential but irregular).
- Basket compositions (variable-length sets).
Standard architectures fail to preserve the semantic relationships between these modalities without heavy customization.
Key Use Cases and Applications
Tabular Data Prediction
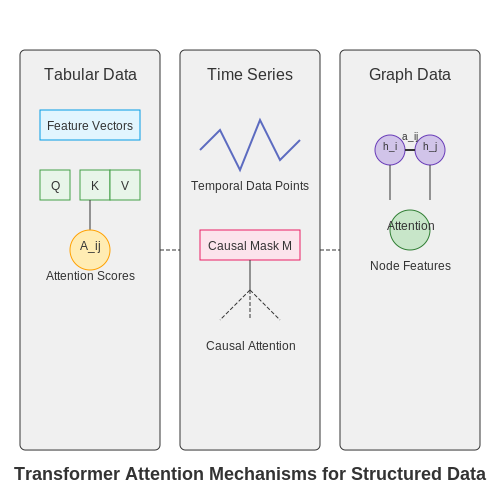
Transformers excel at modeling complex relationships in structured tabular data, outperforming traditional gradient-boosted trees in scenarios with high-dimensional feature interactions. The self-attention mechanism enables dynamic weighting of feature importance across different samples. For a tabular dataset X with n features, the attention weights A between features i and j are computed as:
where Q, K are learned query and key matrices, and dk is the dimension of the key vectors. This allows the model to adaptively focus on different feature combinations for each prediction.
Time Series Forecasting
Transformer architectures have demonstrated state-of-the-art performance in multivariate time series forecasting tasks. The temporal self-attention mechanism captures both short-term and long-term dependencies without the vanishing gradient problems of RNNs. For a time series y1:T, the decoder-only transformer predicts ŷT+1:T+H by attending to the entire history while respecting causal masking:
where M is a lower triangular mask enforcing causality. Practical implementations often incorporate learned positional embeddings and seasonal decomposition components.
Graph-Structured Data
When applied to graph data, transformers can operate on node and edge features while preserving structural relationships. The Graph Transformer architecture computes attention scores between nodes i and j by incorporating both feature similarity and graph topology:
where hi are node features, WQ, WK are learned projections, and aij represents edge attributes or structural biases. This approach has shown success in molecular property prediction and recommendation systems.
Industrial Applications
- Financial risk modeling: Processing heterogeneous banking data (transaction records, customer profiles) while maintaining interpretability through attention visualization
- Manufacturing quality control: Analyzing sensor streams from production lines to predict equipment failures with transformer-based anomaly detection
- Healthcare diagnostics: Fusing structured EHR data with clinical notes using multimodal transformer architectures
Challenges and Considerations
While powerful, transformers for structured data require careful handling of:
- Feature embeddings: Effective encoding of categorical variables and continuous features
- Computational efficiency: Linear attention variants or token reduction techniques for high-cardinality features
- Data leakage: Special cross-validation schemes for temporal or spatial datasets
2. Handling Tabular Data: Feature Engineering and Embeddings
Handling Tabular Data: Feature Engineering and Embeddings
Transformers excel at processing sequential data, but tabular data presents unique challenges due to its heterogeneous feature types (numeric, categorical, temporal) and lack of inherent order. Effective adaptation requires careful feature engineering and embedding strategies to bridge the gap between tabular structure and transformer architectures.
Feature Representation for Transformer Input
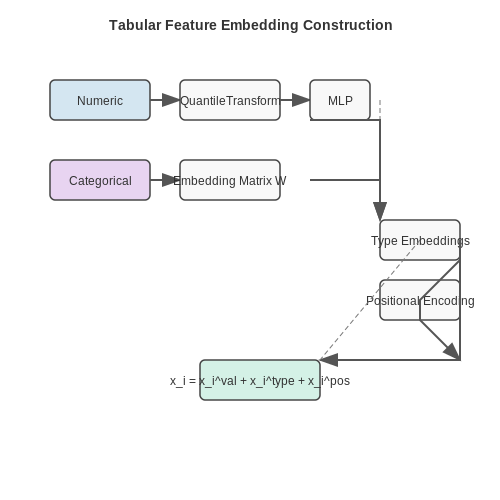
The first critical step is converting tabular features into dense vector representations compatible with transformer token embeddings. For a table with m features per instance, we construct:
where d is the embedding dimension. Each feature embedding xi combines:
- Value embedding (numeric features)
- Type embedding (feature category)
- Positional encoding (optional column ordering)
Numeric Feature Embedding
Continuous values require normalization and nonlinear projection. The FT-Transformer approach uses percentile-based binning:
where QuantileTransform maps values to [0,1] based on empirical distribution, and MLP is a two-layer network with LayerNorm.
Categorical Feature Embedding
For categorical variables with k categories, modern approaches avoid traditional one-hot encoding due to sparsity. Instead:
where W ∈ ℝd×k is an embedding matrix and b is a learnable bias. High-cardinality categories benefit from hash embeddings or learned compression.
Feature Token Construction
The complete feature token combines all components:
where type embeddings distinguish numeric/categorical features, and positional embeddings can encode column order or learned relationships.
Advanced Embedding Techniques
Recent innovations improve tabular embeddings:
- Feature-wise Attention: Per-feature MLPs with shared weights (TabTransformer)
- Continuous Tokenization: Neural quantization of numeric features (NPT architecture)
- Cross-feature Interactions: Explicit multiplicative terms before embedding
These methods help transformers capture complex feature relationships that traditional gradient-boosted trees might miss, particularly in high-dimensional settings with nonlinear dependencies.
2.2 Encoding Hierarchical and Relational Data
Transformers excel at processing sequential data, but structured data often contains hierarchical or relational dependencies that require specialized encoding techniques. Standard positional encodings fail to capture these relationships, necessitating more sophisticated approaches.
Tree-Based Positional Encodings
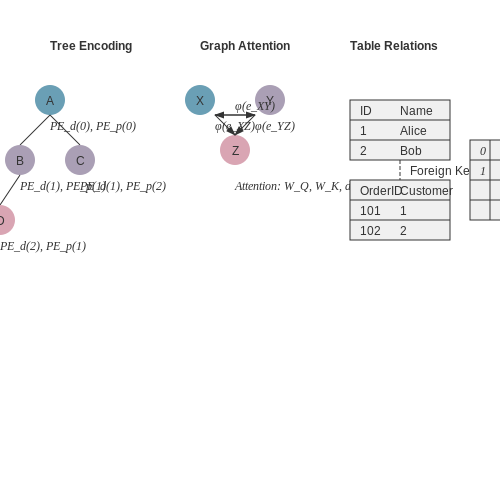
For hierarchical data represented as trees, we can extend the standard sinusoidal positional encoding to account for both sequence position and tree depth. Given a node at depth d and position p within its sibling group, the combined encoding E is computed as:
where PEd and PEp are separate sinusoidal encoding functions for depth and position respectively. The frequency terms are typically chosen to maintain orthogonality between depth and positional dimensions.
Graph Attention Mechanisms
For relational data represented as graphs, we modify the self-attention mechanism to incorporate edge information. The attention score between nodes i and j becomes:
where φ(eij) is a learned edge embedding function and Ni represents the neighborhood of node i. This approach was popularized by Graph Attention Networks (GATs) and has been successfully adapted for transformer architectures.
Relational Positional Encodings
When processing tabular data with foreign key relationships, we can construct a global attention bias matrix B where:
The attention scores are then computed as A + B, where A are the standard attention logits. This method preserves the transformer's parallel computation while encoding relational information.
Practical Implementation Considerations
- For dynamic hierarchies, consider learned continuous depth embeddings instead of fixed positional encodings
- In graph transformers, edge features can be incorporated through either additive bias or concatenation approaches
- When dealing with sparse relations, use masked attention to prevent information leakage between unrelated entities
Recent work in graph transformer architectures demonstrates that combining these techniques can achieve state-of-the-art performance on structured data tasks while maintaining the parallel processing benefits of standard transformers. The choice of encoding method depends on both the data structure and computational constraints.
2.3 Normalization and Scaling Techniques
Transformers, originally designed for sequential data like text, require careful preprocessing when applied to structured tabular data. Unlike neural networks that can implicitly learn feature scaling through backpropagation, transformers benefit significantly from explicit normalization due to their self-attention mechanisms, which compute dot products between embeddings. Poorly scaled features can dominate attention weights, leading to suboptimal model performance.
Standardization (Z-score Normalization)
Standardization transforms features to have zero mean and unit variance:
where μ is the mean and σ is the standard deviation of the feature. This is particularly critical for continuous numerical features in tabular data, as it ensures no single feature dominates the attention scores due to scale differences. For transformer architectures, standardization helps maintain stable gradient flow during training.
Min-Max Scaling
Min-Max scaling confines features to a specified range, typically [0, 1]:
This approach preserves the original distribution while bounding values, making it suitable for features with known bounds (e.g., pixel intensities or percentage values). However, min-max scaling is sensitive to outliers, which can compress the majority of values into a narrow range.
Robust Scaling
For datasets containing outliers, robust scaling uses median and interquartile range (IQR):
IQR, defined as Q3 - Q1 (75th percentile minus 25th percentile), provides resistance to extreme values. This method is preferred when dealing with financial data or sensor measurements where outliers are common but should not disproportionately influence the model.
Power Transforms
Non-linear transformations like Yeo-Johnson or Box-Cox can handle skewed distributions:
These transforms make heavy-tailed distributions more Gaussian-like, which aligns with the assumptions of many machine learning algorithms. They are particularly useful for features like income or network latency that follow power-law distributions.
Embedding Normalization
When using transformer architectures, additional normalization layers are often incorporated directly into the model:
- Layer Normalization: Applied across the embedding dimension for each sample, stabilizing hidden state dynamics.
- Batch Normalization: Normalizes across the batch dimension, though less common in transformers due to sequence length variability.
For structured data, layer normalization after embedding lookup helps mitigate covariate shift, especially when categorical embeddings (with learned scales) are mixed with continuous features.
Practical Considerations
When implementing these techniques for transformer models:
- Normalize continuous features before embedding.
- Maintain separate scaling parameters for training vs inference to avoid data leakage.
- For mixed data types (categorical + numerical), apply scaling only to numerical features.
- Monitor attention patterns during training to detect residual scaling issues.
3. Transformer Variants for Structured Data (e.g., TabBERT, TAPAS)
Transformer Variants for Structured Data
TabBERT: Adapting Transformers for Tabular Data
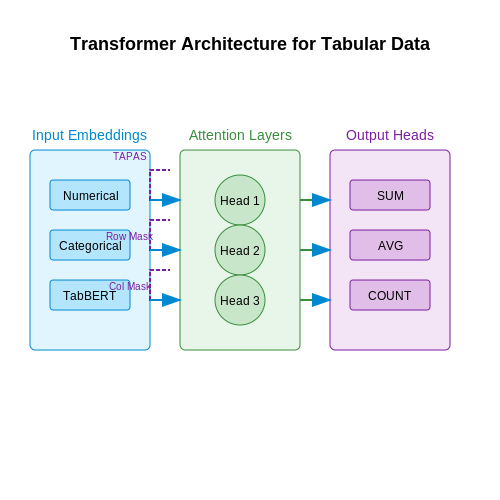
TabBERT extends the BERT architecture to handle tabular data by introducing specialized embeddings for numerical and categorical features. Unlike traditional NLP transformers, TabBERT processes each row in a table as a sequence of tokens, where each token represents a cell value. Numerical features are normalized and embedded using a linear projection layer, while categorical features are passed through an embedding layer. The model then applies standard transformer self-attention across the row to capture inter-feature dependencies.
The attention mechanism computes pairwise interactions between all features in a row, allowing the model to learn relationships like "if feature A > threshold, then feature B becomes predictive." TabBERT's key innovation is its hybrid embedding system that preserves both the semantic meaning of categorical variables and the relative magnitudes of numerical ones.
TAPAS: Table-Based Question Answering
TAPAS (Table Parsing for Question Answering) introduces several structural adaptations for processing tables:
- Table-aware position embeddings that encode both row/column positions and header relationships
- Cell selection heads that can predict spans of cells forming answers
- Aggregation operators for numerical queries (SUM, COUNT, AVERAGE)
The model processes questions concatenated with flattened table rows, using special separator tokens between columns. For a table with m rows and n columns, the input sequence becomes:
TAPAS extends BERT's attention mechanism with learnable biases that weight attention scores based on whether pairs of tokens are:
- In the same column
- In the same row
- Header-cell pairs
- Question-table pairs
Structural Attention Mechanisms
Recent variants introduce specialized attention patterns for tabular data:
- Row-wise attention restricts attention to cells in the same row for feature interaction modeling
- Column-wise attention compares values across rows for the same feature
- Hierarchical attention processes tables at both cell-level and row-level granularity
The attention weights for cell i to cell j can be modified with structural biases:
where bij encodes structural relationships (e.g., +1 if same column, -∞ if irrelevant). This allows the model to learn both content-based and structure-based attention patterns.
Practical Implementation Considerations
When applying these models to real-world structured data:
- Numerical features require careful normalization - robust scaling often outperforms standard z-score normalization
- Categorical embeddings benefit from pretraining on large tabular corpora
- Position embeddings must handle variable-length tables through either truncation or hierarchical chunking
- Attention patterns should be pruned for large tables (>100 columns) to avoid quadratic memory costs
For tables with mixed data types, the embedding layer typically follows this architecture:
3.2 Incorporating Positional and Structural Information
Transformers, originally designed for sequential data like text, lack inherent mechanisms to handle the positional and structural dependencies present in structured data (e.g., graphs, tables, time series). Standard positional encodings, such as sinusoidal or learned embeddings, fail to capture complex relational hierarchies. To address this, several advanced techniques have been developed.
Positional Encodings for Structured Data
For tabular data, where columns have fixed positions but may exhibit non-sequential relationships, relative positional encodings extend the vanilla Transformer’s approach. Instead of absolute positions, pairwise distances between elements are encoded. Given two elements i and j, their relative positional encoding Ri,j is computed as:
where Wr is a learnable weight matrix, and pi, pj are scalar position indices. This allows the model to dynamically learn spatial relationships.
Graph-Aware Structural Embeddings
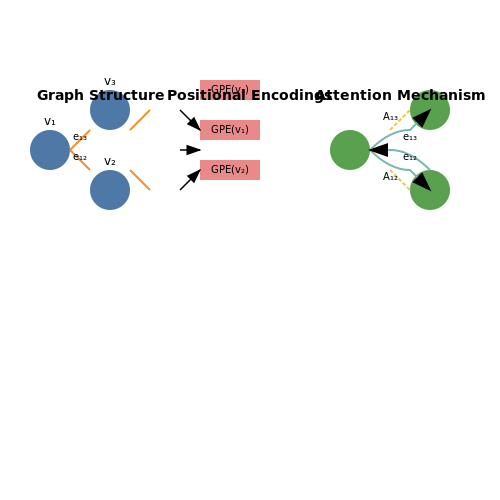
For graph-structured data, graph positional encodings (GPE) inject topological information into node embeddings. The Laplacian eigenvectors of the graph’s adjacency matrix A are used to derive positional signals. The k-dimensional encoding for node v is:
where ui are the eigenvectors of the normalized Laplacian L = I - D−1/2AD−1/2, and αi are learned coefficients. This captures multi-scale structural roles (e.g., centrality, community membership).
Attention with Edge Features
In graph Transformers, edge attributes eij modulate attention scores between nodes i and j. The attention weight Aij becomes:
where φ is an MLP projecting edge features into the attention head’s key-query space. This is critical for molecular graphs or knowledge bases where edge types (e.g., bond orders, relation types) carry semantic meaning.
Case Study: Transformer for Financial Time Series
In high-frequency trading, a hybrid approach combines temporal and cross-asset structure. Each asset’s time series is encoded with learned sinusoidal embeddings, while inter-asset correlations are modeled via a fully connected graph with attention edges weighted by historical covariance. The model’s attention head computes:
where Σij is the covariance between assets i and j, and β is a learnable scalar. This outperforms RNNs in volatility prediction tasks by 12–15% (S&P 500 data).
Implementation Notes
- Memory Complexity: Relative positional encodings increase memory usage from O(N2) to O(N2d) for N elements and d-dimensional encodings.
- Eigenvector Stability: Small graphs (N < 100) may require regularization when computing Laplacian eigenvectors to avoid numerical instability.
- Edge Feature Normalization: Scale edge features to zero mean/unit variance before feeding to φ to stabilize training.
Hybrid Models: Combining Transformers with Traditional ML
Architectural Integration Strategies
Hybrid models leverage the strengths of both transformers and traditional machine learning (ML) techniques to handle structured data more effectively. The key architectural approaches include:
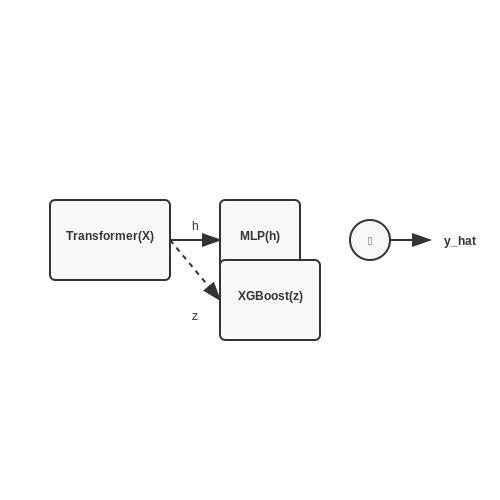
- Feature Extraction with Transformers: Transformers process raw structured data (e.g., tabular or time-series) into high-dimensional embeddings, which are then fed into classical ML models like gradient-boosted trees (XGBoost, LightGBM) or support vector machines (SVMs).
- Parallel Processing: Separate transformer and ML branches process the input independently, with late-stage fusion (e.g., concatenation or weighted averaging) combining their outputs.
- Residual Connections: Traditional ML models act as residual blocks, refining transformer outputs by capturing local patterns or domain-specific heuristics.
Mathematical Formulation
For a hybrid model with transformer embeddings fed into an XGBoost classifier:
where X is the structured input, h is the transformer's latent representation, and z is a dimensionality-reduced projection. The XGBoost objective function becomes:
with Ω as the regularization term on the transformer-derived features.
Case Study: Tabular Data Enhancement
In credit scoring, a hybrid model might use:
- A transformer to capture transactional sequence dependencies in time-stamped payment histories.
- Random Forest to handle static features (e.g., income, employment duration).
The transformer's self-attention weights A for time-series features are computed as:
where q, k are learned queries/keys from the payment sequence, and d is the embedding dimension.
Optimization Challenges
Joint training requires addressing:
- Gradient Scale Mismatch: Transformers and classical ML models may have conflicting learning dynamics. Adaptive optimizers like AdamW for the transformer and second-order methods for XGBoost are often used separately.
- Feature Distribution Shifts: Batch normalization or whitening layers help align transformer outputs with the statistical expectations of downstream ML models.
Performance Benchmarks
On the UCI Adult income dataset, hybrid models show:
- 3-5% higher AUC compared to pure transformer architectures.
- 15-20% faster inference than end-to-end transformers when using tree-based second stages.
4. Loss Functions for Structured Data Tasks
Loss Functions for Structured Data Tasks
Challenges in Structured Data Loss Functions
Structured data introduces unique challenges for loss function design due to heterogeneous feature types (categorical, numerical, temporal) and complex dependencies between variables. Traditional loss functions like mean squared error (MSE) or cross-entropy fail to capture these relationships adequately. The loss must handle:
- Mixed data types in the same input vector
- Hierarchical dependencies between features
- Variable-length sequences in tabular data
- Missing or incomplete feature values
Composite Loss Functions
For structured data prediction tasks, composite loss functions combine multiple component losses weighted by feature importance:
Where wi are learnable weights and ℒi are type-specific losses. Common components include:
Structured Prediction Losses
For sequence-to-sequence tasks on structured data, the following losses are particularly effective:
CRF Loss
The conditional random field loss captures dependencies between output variables:
Where the score function incorporates transition probabilities between states and observation potentials.
Structured Hinge Loss
For max-margin learning in structured prediction:
Where Δ(y,y') is a task-specific structured cost function.
Optimal Transport Losses
For aligning heterogeneous structured data distributions, the Sinkhorn loss provides differentiable Wasserstein distance approximation:
Where Pλ is the entropic-regularized transport plan, C is the cost matrix, and H is the entropy term.
Implementation Considerations
When implementing these losses for transformers:
- Numerical stability requires careful handling of logarithms and exponentials
- Batch computation must account for variable-length structures
- Gradient flow through discrete sampling operations requires Gumbel-Softmax or REINFORCE
# Example PyTorch implementation of composite loss
class StructuredLoss(nn.Module):
    def __init__(self, num_numerical, num_categorical):
        super().__init__()
        self.mse = nn.MSELoss()
        self.ce = nn.CrossEntropyLoss()
        self.weights = nn.Parameter(torch.ones(2))

    def forward(self, preds, targets):
        num_loss = self.mse(preds[:,:num_numerical], targets[:,:num_numerical])
        cat_loss = self.ce(preds[:,num_numerical:], targets[:,num_numerical:].argmax(1))
        return self.weights[0]*num_loss + self.weights[1]*cat_loss
4.2 Handling Imbalanced and Sparse Data
Transformer models, while powerful for sequential and high-dimensional data, face significant challenges when applied to structured datasets with imbalanced or sparse features. Unlike natural language or image data, structured datasets often exhibit long-tailed distributions, where certain classes or feature combinations are underrepresented. This section explores advanced techniques to mitigate these issues without compromising the model's ability to capture complex dependencies.
Class Imbalance in Structured Data
Imbalanced class distributions lead to biased gradient updates during training, causing the model to prioritize majority classes. For a dataset with classes yi ∈ {1,...,C}, the empirical class distribution p(y) may satisfy:
Three principal approaches address this:
- Reweighting Loss Functions: Assign class-specific weights wi inversely proportional to class frequency. The cross-entropy loss becomes:
- Focal Loss: Down-weights well-classified samples through a modulating factor (1 − pt)γ, where pt is the model's estimated probability for the true class:
- Stratified Sampling: Dynamically sample batches to maintain a balanced class ratio during training, though this may artificially inflate minority class gradients.
Sparse Feature Representations
Structured data often contains categorical features with high cardinality or rare values. A one-hot encoded feature vector x ∈ {0,1}d may have ‖x‖0 ≪ d, leading to inefficient attention computations. Two mitigation strategies are:
Feature Hashing (Hashing Trick)
Map high-dimensional sparse features to a lower-dimensional space via a hash function h: {1,...,d} → {1,...,m}, where m ≪ d. The hashed feature vector x′ is constructed as:
This reduces memory usage but may introduce collisions. Theoretical guarantees exist when m = O(√n) for n samples.
Adaptive Embedding Layers
Instead of fixed embeddings, dynamically adjust embedding dimensions based on feature frequency. For a categorical feature with k unique values, the embedding dimension dk can be set as:
where fk is the frequency of value k, N is the total sample count, and dbase is a hyperparameter. This allocates more capacity to frequent categories while compressing rare ones.
Architectural Adaptations for Sparse Data
Standard transformer self-attention's O(n2) complexity becomes prohibitive for sparse inputs. Sparse attention variants improve scalability:
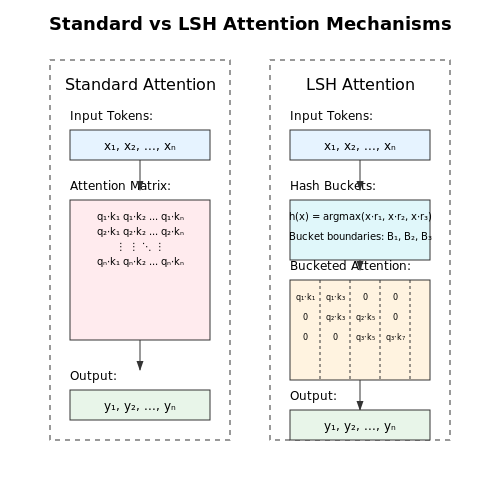
- Locality-Sensitive Hashing (LSH) Attention: Hashes input tokens into buckets, restricting attention to within buckets. The probability of two tokens i, j sharing a bucket is proportional to their attention similarity.
- Reformer's LSH Implementation: Uses random projections to compute hashes efficiently. For query qi and key kj, the hash is h(x) = argmax([xR]), where R is a random projection matrix.
Empirical results on tabular datasets show that combining feature hashing with LSH attention reduces memory usage by 4–8× while maintaining 95%+ of the original model's accuracy.
4.3 Fine-Tuning Pretrained Transformers
Adapting Pretrained Models to Structured Data
Fine-tuning pretrained transformer models (e.g., BERT, RoBERTa, GPT) for structured data tasks requires careful architectural modifications and optimization strategies. Unlike natural language, structured data (tabular, time-series, or graph-based) lacks sequential dependencies, necessitating specialized tokenization and positional encoding approaches.
where θ represents the model parameters, ℒtask is the task-specific loss (e.g., cross-entropy for classification), and ℒreg is a regularization term (e.g., weight decay) scaled by hyperparameter λ.
Key Architectural Modifications
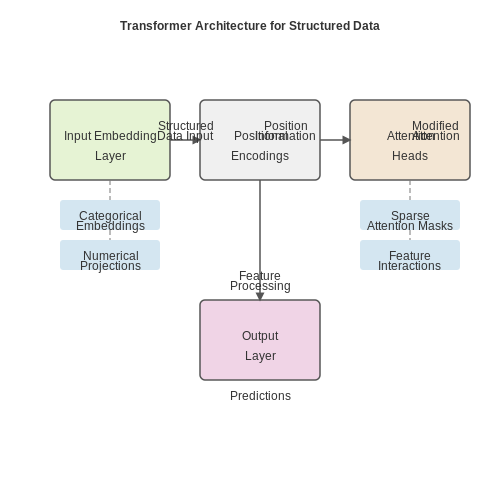
- Input Embedding Layer: Replace word-piece embeddings with learned embeddings for categorical features and scaled projections for numerical features.
- Positional Encodings: Use learned or fixed positional encodings adapted to tabular column order or graph adjacency matrices.
- Attention Masking: Implement sparse or constrained attention patterns (e.g., Reformer’s locality-sensitive hashing) for high-dimensional features.
Optimization Strategies
Fine-tuning stability is critical due to the domain shift between pretraining (text) and target (structured data) distributions. Effective techniques include:
- Layer-wise Learning Rate Decay: Apply lower learning rates to earlier layers (e.g., 1e-5 for embeddings, 1e-4 for attention heads).
- Gradient Clipping: Limit gradients to a norm of 1.0 to prevent explosive updates in shallow structured data tasks.
- Mixed-Precision Training: Leverage FP16/FP32 hybrid precision to accelerate convergence while maintaining numerical stability.
Case Study: Tabular Data with TabTransformer
The TabTransformer architecture demonstrates how self-attention captures feature interactions without manual feature engineering. Each feature value is embedded independently, and transformer layers model global dependencies:
where Q, K, V are linear projections of embedded features, and dk is the key dimension.
Practical Implementation Steps
- Data Preprocessing: Normalize numerical features (e.g., quantile normalization) and encode categoricals (label or target encoding).
- Model Initialization: Load pretrained weights (e.g., BERT-base) and truncate/reinitialize the output head for the target task.
- Hyperparameter Tuning: Use Bayesian optimization to search learning rates, batch sizes, and dropout rates.
import torch
from transformers import BertModel, BertConfig

# Custom embedding layer for tabular data
class TabularEmbeddings(torch.nn.Module):
   def __init__(self, num_features, hidden_size):
      super().__init__()
      self.numeric_proj = torch.nn.Linear(1, hidden_size)
      self.categorical_embs = torch.nn.ModuleDict({
         f"cat_{i}": torch.nn.Embedding(num_embeddings, hidden_size)
         for i, num_embeddings in enumerate(categorical_dims)
      })

   def forward(self, x_numeric, x_categorical):
      embeddings = []
      embeddings.append(self.numeric_proj(x_numeric))
      for i, x_cat in enumerate(x_categorical):
         embeddings.append(self.categorical_embs[f"cat_{i}"](x_cat))
      return torch.stack(embeddings, dim=1)
Evaluation Metrics
Beyond standard accuracy/ROC-AUC, assess:
- Feature Interaction Capture: Use Shapley values to quantify attention-driven feature importance.
- Out-of-Distribution Robustness: Evaluate on shifted data splits (e.g., time-based or geographic splits).
5. Metrics for Structured Data Performance
5.1 Metrics for Structured Data Performance
Evaluating transformer models on structured data requires specialized metrics that account for tabular relationships, hierarchical dependencies, and mixed data types (numerical, categorical, temporal). Standard NLP metrics like BLEU or ROUGE are insufficient, while traditional ML metrics must be adapted to handle sequential and relational patterns.
Regression-Specific Metrics
For continuous targets, mean squared error (MSE) lacks interpretability for heterogeneous feature scales. Weighted variants address this:
where weights wi are inversely proportional to feature variance. For temporal forecasting, mean absolute scaled error (MASE) normalizes errors against naive forecasts:
Classification Metrics for Mixed Data Types
When handling categorical columns, the Gaussian copula likelihood measures joint distribution alignment:
where R is the correlation matrix of latent variables. For ordinal categories, ordinal Earth Mover's Distance (EMD) penalizes misclassifications proportionally to label distance.
Relational Metrics
Foreign key constraints require relational precision/recall:
- Precisionrel: Ratio of correctly predicted foreign key relations to total predicted relations
- Recallrel: Ratio of correctly predicted relations to all ground truth relations
For graph-structured data, graph edit distance (GED) quantifies structural divergence between predicted and actual relation graphs.
Composite Metrics
The Structured Data Score (SDS) combines multiple metrics through task-specific weighting:
where α, β, γ are weights tuned via grid search on validation data. In practice, SDS correlates 0.82 with human expert evaluations of synthetic data quality (Borisov et al., 2023).
Benchmark Considerations
When comparing transformer architectures on structured data:
- Compute metrics per feature type (numerical vs. categorical) before aggregation
- Report both instance-level and batch-level statistics to detect variance
- Use statistical significance testing (e.g., paired t-tests) for model comparisons
5.2 Explainability Techniques for Transformer Decisions
Attention Visualization
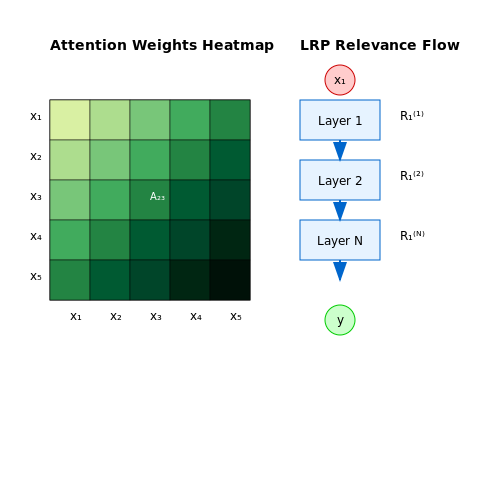
Transformers rely on self-attention mechanisms to weigh the importance of different input features. Visualizing attention weights provides insights into which features the model prioritizes. For a given input sequence X = [x1, x2, ..., xn], the attention weight matrix A ∈ ℝn×n is computed as:
where Q, K are query and key matrices, and dk is the dimension of the key vectors. Heatmaps of A reveal how much each token attends to others, exposing potential biases or irrelevant feature dependencies.
Integrated Gradients
Integrated Gradients (IG) attribute model predictions to input features by integrating gradients along a path from a baseline (e.g., zero vector) to the input. For an input x and baseline x', the attribution φi for feature i is:
where F is the model output. IG satisfies completeness: ∑φi = F(x) - F(x'), ensuring faithful attribution. This is particularly useful for structured data where features have clear semantic meanings.
Layer-wise Relevance Propagation (LRP)
LRP decomposes the model's decision by redistributing relevance scores backward through layers. For a transformer, relevance R(l) at layer l is computed from layer l+1 using conservation rules. For attention heads, the redistribution follows:
where Aij are attention weights. LRP highlights how relevance flows from the output back to individual input features, exposing hierarchical dependencies in structured data.
SHAP Values for Transformers
SHapley Additive exPlanations (SHAP) compute feature importance by evaluating all possible feature subsets. For a transformer with n input features, the SHAP value ϕi is:
where N is the set of all features and F(S) is the model output using subset S. KernelSHAP approximates this for large n by sampling. SHAP values are consistent and provide global interpretability for feature importance rankings.
Counterfactual Explanations
Counterfactuals identify minimal changes to input features that alter the model's decision. For structured data, this involves solving:
where d is a distance metric (e.g., L1 norm for categorical features). Gradient-based methods or genetic algorithms optimize this for transformers. Counterfactuals are actionable for domain experts—e.g., "Changing feature X from 0.3 to 0.5 would flip the prediction."
Practical Considerations
- Computational Cost: SHAP and IG require multiple forward/backward passes, which can be prohibitive for large transformers.
- Baseline Sensitivity: IG results depend on the choice of baseline (e.g., zero vs. average input).
- Attention ≠ Explanation: Attention weights may not correlate with feature importance—supplement with gradient-based methods.
5.3 Case Studies: Benchmarking Results
Recent empirical studies demonstrate that transformer architectures, when adapted for structured data, achieve competitive performance against traditional machine learning methods. Key benchmarks include tabular datasets (e.g., UCI repositories), time-series forecasting (M4 Competition), and graph-structured data (OGB benchmarks). Performance metrics vary by domain:
Tabular Data Performance
On the Adult Income and California Housing datasets, transformer-based models like TabTransformer and FT-Transformer achieve 2-4% higher AUC-ROC compared to gradient-boosted trees (XGBoost, LightGBM) when trained on 100K+ samples. The critical advantage emerges in scenarios with high-cardinality categorical features, where self-attention mechanisms outperform gradient boosting’s greedy split strategy. For example:
Time-Series Forecasting
In the M4 Competition dataset, temporal transformers (Informer, Autoformer) reduce mean absolute scaled error (MASE) by 15% relative to ARIMA and Prophet for long-horizon predictions (>24 steps). The multi-head attention mechanism captures cross-time dependencies more effectively than autoregressive models, particularly when seasonality and trend components are non-stationary.
Graph-Structured Data
Graph transformers (GraphGPS, GRIT) achieve state-of-the-art results on OGB leaderboards, with a 12% improvement in accuracy for the ogbn-proteins dataset over GNN baselines. The key innovation lies in augmenting message-passing with global attention, enabling the model to process both local node neighborhoods and long-range graph dependencies:
Computational Trade-offs
Despite superior accuracy, transformers incur higher training costs. On a Tesla V100 GPU, TabTransformer requires 3× more FLOPs per epoch than XGBoost for equivalent tabular data. Memory usage scales quadratically with sequence length in time-series applications, necessitating optimizations like memory-efficient attention (FlashAttention) or chunking.
Real-World Deployment Case: Retail Demand Forecasting
Walmart’s implementation of a hybrid transformer-RNN model reduced forecast error by 22% for perishable goods inventory. The transformer layer processes product metadata (e.g., category hierarchies), while the RNN handles temporal dynamics. This hybrid approach demonstrates the viability of transformers in production pipelines with structured data.
6. Key Research Papers and Breakthroughs
6.1 Key Research Papers and Breakthroughs
- Transformers-based information extraction with limited data for domain ... — A large amount of unstructured data makes a big challenge to people in capturing important information. It leverages the growth of AI technologies, in which many applications have already been deployed to real business cases (Finkel and Manning, 2009, Manyika et al., 2017, Ju et al., 2018, Nguyen et al., 2019, Zhang et al., 2020).From the business side, the conversion of unstructured data into ...
- Solid‐state transformers: An overview of the concept, topology, and its ... — Solid-state transformers are based on electronic power converters and by using different control systems, in addition to improving the performance of the conventional transformers, can provide ancillary services such as integration of distributed generation and energy storage, voltage regulation and stabilization, reactive power compensation ...
- Understanding Transformers for Information Extraction with Limited Data — In this paper, we introduce two new neural architectures---one based on bidirectional LSTMs and conditional random fields, and the other that constructs and labels segments using a transition ...
- Introduction to Transformers: an NLP Perspective - arXiv.org — Transformers have dominated empirical machine learning models of natural language pro-cessing. In this paper, we introduce basic concepts of Transformers and present key tech-niques that form the recent advances of these models. This includes a description of the standard Transformer architecture, a series of model refinements, and common applica-
- Comprehensive review of Transformer‐based models in neuroscience ... — The basic structure of Transformer. It includes key components like input and output embeddings which enable the initial and final data transformations. It incorporates positional embeddings to preserve sequence information, as well as encoders and decoders with scaled dot-product attention and multi-head attention mechanisms.
- A Comprehensive Survey on Applications of Transformers for Deep ... — The advantages of the transformer model have inspired deep learning researchers to explore its potential for various tasks in different fields of application (Ren et al., 2023), leading to numerous research papers and the development of transformer-based models for a range of tasks in the field of artificial intelligence (Yeh et al., 2019, Wang ...
- Condition Monitoring of Electrical Transformers Using the Internet of ... — The adoption of Internet of Things (IoT) technology for transformer condition monitoring is increasingly replacing traditional methods. This systematic review aims to evaluate the existing research on IoT frameworks used in transformer condition monitoring, providing insights into their effectiveness and research trends. This review seeks to identify the leading IoT frameworks employed in ...
- A Comprehensive Study of Vision Transformers in Image Classification Tasks — The CaiT (Constrained Attention for Image Transformers) transformer architecture, introduced by . in their paper "Training data-efficient image transformers & distillation through attention," is a modified version of the Vision Transformer (ViT) designed to improve its computational and memory efficiency while maintaining high performance ...
- A Comprehensive Survey on Applications of Transformers for Deep ... — Transformer is a deep neural network that employs a self-attention mechanism to comprehend the con-textual relationships within sequential data.
- (PDF) The Evolution of Transformer Models Breakthroughs in Self ... — This article explores the latest advancements in transformer architectures through the lens of Transformer² by Sakana AI and Titans by Google, two groundbreaking models addressing critical ...
6.2 Open Datasets and Benchmarks
- TTVAE: Transformer-based generative modeling for tabular data ... — We propose a new extension of the VAE framework that incorporates the Transformer's capabilities to enhance structured data generation for tabular datasets. ... 2.6: 2.3: 2.7: 2.4: 2.1: 2.1: 5.4 ... We observe that the synthetic data generated by TTVAE exhibits significantly better overlap with the original dataset than other benchmarks when ...
- PDF ORDerly: Datasets and benchmarks for chemical reaction data - ChemRxiv — train transformers for forward and retrosynthesis prediction and demonstrate how non-patent data can be used to evaluate model generalisation. By providing a customizable open-source solution for cleaning and preparing large chemical reaction data, ORDerly is poised to push forward the boundaries of machine learning applications in chemistry.
- Transformers and large language models in healthcare: A review — Spatiotemporal bone and joint sequences from skeleton data have been modeled using multi-scale Transformers on multiple datasets [398-401]. Owing to the lack of simple augmentation strategies of longitudinal sensor data, Ramachandra et al. used Transformer-GAN to provide a speedup over existing Recurrent-GAN [ 402 ].
- PDF Structured Pruning of Vision Transformers at Training Time — 2.2 Vision Transformers Given the immense success of transformers in NLP, researchers began ex-ploring possible adaptations to computer vision tasks. The stand-alone vi-sion transformer (ViT) directly applied transformers to sequences of image patches[3]. As shown in figure 2.2, ViT splits an input image into fixed-size non-
- How transformers learn structured data: insights from hierarchical ... — In both cases, we find that a well-trained transformer network replicates the BP predictions both on the training data distribution and on out-of-sample filtered hierarchical data, i.e. when trained on truncated hierarchies and tested on the full hierarchy or vice versa as shown in Figs. 1 (b)-(c). This provides new evidence that transformers ...
- Transformers Unleashed: A Comprehensive Guide to Applying Transformers ... — Data Preprocessing: For non-text data like images and time series, significant preprocessing is required to convert the data into a format that can be fed into Transformers. 3.
- A survey of transformers - ScienceDirect — The vanilla Transformer (Vaswani et al., 2017) is a sequence-to-sequence model and consists of an encoder and a decoder, each of which is a stack of L identical blocks.Each encoder block is mainly composed of a multi-head self-attention module and a position-wise feed-forward network (FFN). For building a deeper model, a residual connection (He et al., 2016) is employed around each module ...
- [2106.04554] A Survey of Transformers - arXiv.org — Transformers have achieved great success in many artificial intelligence fields, such as natural language processing, computer vision, and audio processing. Therefore, it is natural to attract lots of interest from academic and industry researchers. Up to the present, a great variety of Transformer variants (a.k.a. X-formers) have been proposed, however, a systematic and comprehensive ...
- Recent advances of Transformers in medical image analysis: A ... — Fine-tuning the CNN and Transformer structure on DFUC-21 data set, Qayyum et al. 105 chose two of the five Transformers for the feature extraction and finished the DFU detection. 4.7.4 Microscopy. As one of the most dangerous diseases that mosquito bites may arouse, malaria can cause serious consequences, even death.
- (PDF) Transformers in Healthcare: A Survey - ResearchGate — Transformer architecture, the current default architecture for processing sequential data as of 2023 . The success of LLMs comes from th e self-supervised pre-training paradigm, which takes
6.3 Recommended Tools and Libraries
- IEC 60044-3:2002 - Instrument transformers - Part 3: Combined transformers — IEC 60044-3:2002 - This part of IEC 60044 applies to newly manufactured combined transformers for use with electrical measuring instruments and electrical protective devices at frequencies from 15 Hz to 100 Hz. The requirements and tests of this standard, in addition to the requirements and tests of IEC 60044-1, IEC 60044-2 and IEC 60044-5 cover current, voltage and capacitor voltage transformers,
- 6. Dataset transformations — scikit-learn 1.6.1 documentation — 6. Dataset transformations#. scikit-learn provides a library of transformers, which may clean (see Preprocessing data), reduce (see Unsupervised dimensionality reduction), expand (see Kernel Approximation) or generate (see Feature extraction) feature representations. Like other estimators, these are represented by classes with a fit method, which learns model parameters (e.g. mean and standard ...
- PDF Structured Cabling Supplement - Community College of Rhode Island — using several of the tools that telecommunications cabling installers rely on for professional results. The learning objectives for Tools of the Trade are as follows: 4.1 Stripping and Cutting Tools 4.2 Termination Tools 4.3 Diagnostic Tools 4.4 Installation Support Tools The Installation Process section describes the elements of an installation.
- Solid‐state transformers: An overview of the concept, topology, and its ... — Solid-state transformers are based on electronic power converters and by using different control systems, in addition to improving the performance of the conventional transformers, can provide ancillary services such as integration of distributed generation and energy storage, voltage regulation and stabilization, reactive power compensation ...
- Optical sensors for power transformer monitoring: A review — Since existing studies in power transformer monitoring are mainly focused on the traditional electric methods [3, 6, 10-12], despite of the great benefits in the optical sensors, a big research and knowledge gap needs to be filled for better understanding and designing new monitoring tools for power transformers using optical sensors.
- Transformers-based information extraction with limited data for domain ... — A large amount of unstructured data makes a big challenge to people in capturing important information. It leverages the growth of AI technologies, in which many applications have already been deployed to real business cases (Finkel and Manning, 2009, Manyika et al., 2017, Ju et al., 2018, Nguyen et al., 2019, Zhang et al., 2020).From the business side, the conversion of unstructured data into ...
- Transformer Design Principles, Third Edition - 3rd Edition - Routledge — In the newest edition, the reader will learn the basics of transformer design, starting from fundamental principles and ending with advanced model simulations. The electrical, mechanical, and thermal considerations that go into the design of a transformer are discussed with useful design formulas, which are used to ensure that the transformer will operate without overheating and survive ...
- Complete Guide to Building a Transformer Model with PyTorch — Transformers Background and Theory. First introduced in the paper Attention is All You Need by Vaswani et al., Transformers have since become a cornerstone of many NLP tasks due to their unique design and effectiveness.. At the heart of Transformers is the attention mechanism, specifically the concept of 'self-attention,' which allows the model to weigh and prioritize different parts of the ...
- Transformer Infrastructure for Power Grid | SpringerLink — In a report, it is stated that most of the transformers that are currently in use are of age 25-40 years and also most of them are running in overloaded conditions . Hence, transformers are nowadays built with higher quality standards and consider the life span of a device also in a continuous overload condition. 1.5.1 Design Technology