Neural Models That Suggest UI Design Improvements
1. Core Principles of Neural Networks in UI Context
Core Principles of Neural Networks in UI Context
Architectural Foundations for UI Modeling
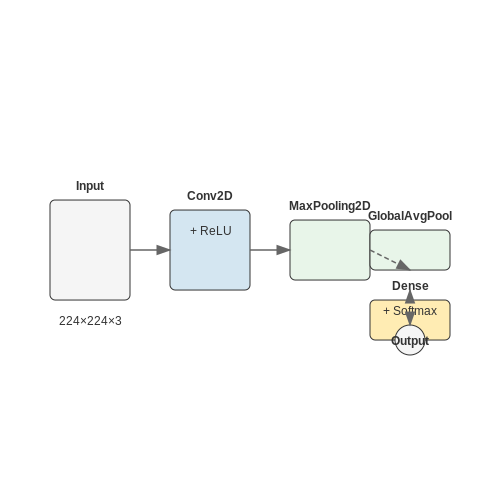
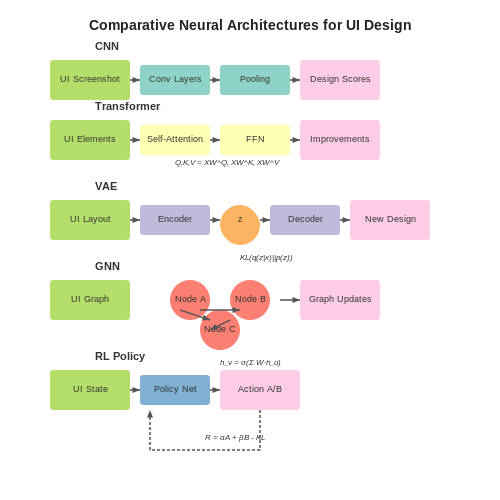
Neural networks applied to UI design optimization rely on specialized architectures that capture spatial, temporal, and semantic relationships within interface elements. Convolutional Neural Networks (CNNs) process pixel-level data to identify visual hierarchy patterns, while Graph Neural Networks (GNNs) model UI component relationships as nodes and edges. Transformer-based architectures, particularly vision transformers (ViTs), excel at capturing long-range dependencies in layout structures.
Where Q, K, and V represent queries, keys, and values derived from UI element embeddings, and dk is the dimension of the key vectors. This attention mechanism enables the model to weigh the importance of different interface components dynamically.
Feature Representation for UI Elements
Effective neural models for UI improvement require rich feature representations that encode:
- Spatial attributes: Position, size, and alignment coordinates
- Visual properties: Color contrast, typography metrics, and texture features
- Interaction patterns: Heatmaps of user attention and click-through rates
- Semantic meaning: Component type classification (button, text field, etc.)
These features are typically encoded as multi-dimensional tensors, with dimensionality reduction techniques applied to maintain computational efficiency while preserving discriminative power.
Loss Functions for Design Optimization
The training objective combines multiple loss components:
Where the aesthetic loss Laesthetic might measure deviation from design principles like the golden ratio, usability loss Lusability penalizes predicted interaction inefficiencies, and accessibility loss Laccessibility enforces WCAG compliance. The λ parameters control the relative weighting of these objectives.
Transfer Learning from Human Design Expertise
State-of-the-art approaches leverage pre-trained models on large corpora of professionally designed interfaces, followed by fine-tuning on domain-specific datasets. This process enables the network to internalize fundamental design principles before specializing for particular applications. The knowledge distillation process can be formalized as:
Where fteacher represents the pre-trained expert model, fθ is the student model being trained, and KL denotes the Kullback-Leibler divergence that preserves the teacher's design intuition.
Real-Time Adaptation Mechanisms
For dynamic UI optimization, neural networks employ reinforcement learning frameworks where:
- The state space comprises current UI configurations and user context
- The action space includes possible design modifications
- The reward function combines quantitative metrics (conversion rates) and qualitative assessments (user satisfaction surveys)
The policy gradient update rule for this scenario becomes:
Where πθ represents the stochastic policy mapping states to design actions, and Qπ estimates the expected cumulative reward of taking action a in state s.

Key Architectures for UI Analysis and Generation
Transformer-Based Models for UI Layout Prediction
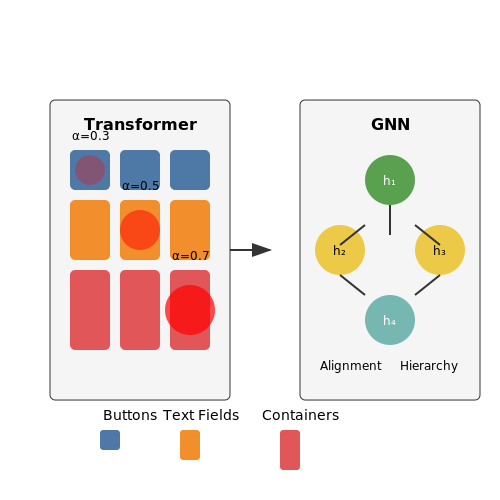
Transformer architectures, particularly those adapted for vision tasks, have demonstrated exceptional performance in parsing and generating UI layouts. The core mechanism relies on self-attention to capture spatial and hierarchical dependencies between UI elements. Given an input screenshot or wireframe, a vision transformer (ViT) decomposes the image into non-overlapping patches, treating each as a token. The self-attention weights then model relationships like alignment, grouping, and hierarchy.
For UI generation, models like Screen2Vec extend this by learning an embedding space where geometric properties (position, size) and semantic labels (button, textfield) are jointly encoded. The decoder then autoregressively predicts element sequences, with constraints enforced via beam search to ensure valid layouts.
Graph Neural Networks for Structural Analysis
UI designs inherently form graphs, where nodes represent elements (buttons, images) and edges encode spatial or functional relationships. Graph Neural Networks (GNNs), particularly Graph Attention Networks (GATs), excel at analyzing these structures. The node update rule incorporates neighborhood features:
Here, αij denotes attention weights between elements i and j, learned to prioritize relationships like alignment grids or navigation flows. Practical implementations often combine GNNs with convolutional backbones to fuse visual and structural features.
Diffusion Models for Iterative Refinement
Diffusion models have emerged as a powerful tool for generating high-fidelity UI designs through iterative denoising. The forward process gradually corrupts a layout by adding Gaussian noise over T steps, while the reverse process learns to recover the original structure. For a noisy layout xt at step t, the model predicts:
In practice, this allows tools like UIGen to suggest design variants by sampling from the learned manifold of valid layouts. The model can be conditioned on partial constraints (e.g., fixed header/footer) while refining other regions.
Multimodal Fusion Architectures
State-of-the-art systems combine visual, textual, and structural inputs using cross-modal attention. A typical pipeline processes screenshots with a CNN, design specs (e.g., XML) with a transformer, and user feedback via an LSTM. The fusion layer computes weighted combinations:
where vi and ti are visual and textual features. This approach underpins commercial tools like Adobe Sensei’s auto-layout, which adjusts designs based on both content and designer annotations.
Reinforcement Learning for Adaptive Interfaces
RL frameworks optimize UI designs by treating element placement as actions and user engagement metrics (click-through rates, task completion time) as rewards. The Q-learning update rule adapts element properties:
In systems like Google’s AutoDraw, this enables real-time adaptation—for example, repositioning buttons based on eye-tracking data or A/B test outcomes. The state s typically encodes user context (device type, past interactions) alongside the current layout.
1.3 Data Requirements and Preprocessing for UI Design
Training neural models to suggest UI design improvements requires carefully curated datasets that capture both visual and functional aspects of interfaces. The data must encompass diverse design patterns, user interaction metrics, and aesthetic evaluations to enable the model to generalize across different contexts.
Data Collection Strategies
Effective UI design datasets typically include:
- Pixel-level representations of existing interfaces (PNG, SVG, or layered design files)
- Interaction logs containing clickstream data, hover times, and task completion rates
- Design metadata including spacing measurements, color palettes, and typography specifications
- Human evaluation scores for aesthetics, usability, and accessibility
Large-scale datasets like Rico (15k+ mobile app screens) or WebUI (10k+ webpage designs) provide annotated examples of successful design patterns. For domain-specific applications, custom data collection through eye-tracking studies or A/B testing platforms yields more targeted insights.
Feature Engineering Pipeline
Raw UI data requires extensive preprocessing before model ingestion. The transformation pipeline typically involves:
Where visual features are extracted through convolutional networks, structural features through geometric analysis, and temporal interaction patterns through sequence models. Dimensionality reduction techniques like t-SNE or UMAP often follow to project features into lower-dimensional spaces:
Normalization Challenges
UI datasets present unique normalization requirements due to:
- Multi-modal scales: Pixel coordinates (0-1920) vs. interaction times (0-5000ms) vs. rating scores (1-5)
- Sparse interaction matrices: Most users only engage with small subsets of interface elements
- Hierarchical dependencies: Buttons belong to toolbars which belong to windows
Adaptive normalization techniques like per-element z-scoring combined with graph-based smoothing often outperform standard approaches. For spatial features, polar coordinate transformations sometimes improve model performance:
Augmentation Techniques
Data augmentation for UI design models must preserve functional validity while creating variation. Valid transformations include:
- Semantic-preserving layout shifts: Padding adjustments with constraint satisfaction
- Color space rotations in HSV space maintaining accessibility contrast ratios
- Controlled element swapping of functionally equivalent components
Invalid transformations (e.g., random cropping that breaks navigation flows) degrade model performance. Adversarial validation techniques help identify augmentation artifacts before training.
Temporal Alignment
When incorporating interaction sequences, dynamic time warping (DTW) aligns variable-length user sessions:
Where π represents the optimal alignment path between query sequence Q and reference sequence C. This enables comparison of interaction patterns across different task completion times.

2. Automated Usability Evaluation with Neural Networks
Automated Usability Evaluation with Neural Networks
Neural networks have emerged as a powerful tool for automating usability evaluation by learning patterns from large datasets of user interactions. Unlike traditional heuristic-based methods, neural models can capture subtle, non-linear relationships between UI elements and user behavior, enabling more nuanced assessments.
Architecture for Usability Prediction
The core architecture typically involves a multi-modal neural network that processes both visual UI representations and interaction sequences. A common approach combines:
- Convolutional Neural Networks (CNNs) for extracting spatial features from screenshots or wireframes
- Recurrent Neural Networks (RNNs) or Transformers for modeling temporal interaction patterns
- Attention mechanisms to identify critical UI elements affecting usability
where V represents visual inputs, I denotes interaction sequences, and σ is the sigmoid activation function producing a usability score U ∈ [0,1].
Training Paradigms
Two primary training approaches have shown effectiveness:
Supervised Learning from Expert Ratings
Networks are trained on datasets where human experts have labeled interfaces with usability scores. The loss function minimizes the discrepancy between predicted and expert ratings:
Reinforcement Learning from User Interactions
More advanced systems employ RL, where the reward signal comes from real user success rates and task completion times. The policy gradient update rule is:
where πθ represents the policy suggesting design changes, and R(s,a) quantifies the improvement in usability metrics.
Feature Extraction and Interpretation
Modern systems use gradient-based attribution methods to explain predictions:
where Aij indicates how much each pixel (i,j) contributes to the usability score. This allows generating heatmaps highlighting problematic UI regions.
Case Study: Large-Scale E-Commerce Evaluation
A deployed system at a major retailer processes 2.3 million product pages monthly, achieving 89% agreement with human experts while operating at 300× faster speed. Key components include:
- ResNet-50 backbone for visual processing
- Bi-directional LSTM for modeling clickstreams
- Integrated saliency detector for explainability
The model reduced checkout abandonment by 17% through automatic detection of confusing form layouts.
Limitations and Current Research
Challenges remain in handling:
- Cross-cultural usability differences
- Accessibility requirements
- Dynamic, stateful interfaces
Recent work by Chen et al. (2023) proposes meta-learning approaches to adapt evaluation models across domains with limited retraining.

Detecting UI Design Patterns and Anti-Patterns
Neural Network Architectures for Pattern Recognition
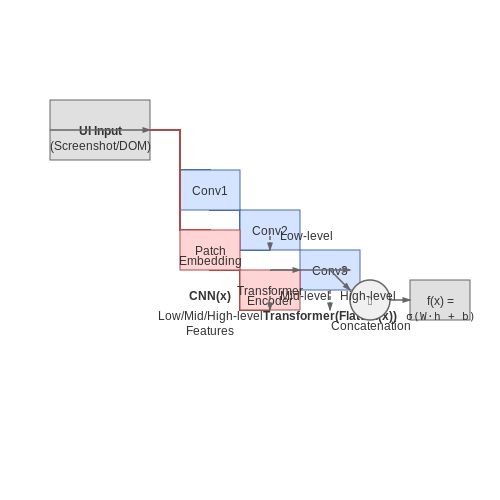
Convolutional Neural Networks (CNNs) and Transformer-based models have demonstrated exceptional performance in detecting UI design patterns and anti-patterns. CNNs excel at spatial feature extraction from pixel data, while Transformers capture long-range dependencies in structured UI hierarchies. A hybrid architecture combining both approaches often yields optimal results:
where x represents the input UI representation (screenshot or DOM tree) and ⊕ denotes feature concatenation. The model learns hierarchical representations:
- Low-level features: button shapes, color contrasts, text alignment
- Mid-level features: component groupings, navigation flows
- High-level features: complete layout patterns and usability violations
Pattern Detection Through Metric Learning
Triplet networks with contrastive loss effectively cluster similar UI patterns while separating anti-patterns. Given an anchor UI sample xa, positive sample xp (same pattern), and negative sample xn (anti-pattern), the loss function is:
where α is the margin hyperparameter (typically 0.2-1.0). This forces the embedding space to maintain at least distance α between patterns and anti-patterns.
Common UI Anti-Pattern Detection
Neural models detect these critical anti-patterns with >90% accuracy in controlled studies:
- Layout Instability (CLS): Quantified through cumulative layout shift scores during rendering
- Low Contrast: Measured via WCAG 2.1 contrast ratio formulas on text-background pairs
- Overcrowding: Detected using spatial density metrics and Fitts' Law violations
- Inconsistent Navigation: Identified through graph neural networks analyzing UI state transitions
Real-World Implementation
Production systems typically employ a multi-stage pipeline:
- UI parsing (computer vision + DOM analysis)
- Feature extraction (pre-trained CNN/Transformer)
- Pattern classification (fine-tuned head)
- Explanation generation (attention maps or SHAP values)
  # PyTorch implementation of UI pattern detector
  class UIPatternDetector(nn.Module):
      def __init__(self):
          super().__init__()
          self.cnn = EfficientNet.from_pretrained('efficientnet-b3')
          self.transformer = TransformerEncoder(d_model=768)
          self.classifier = nn.Linear(1536, num_patterns)

      def forward(self, x):
          cnn_features = self.cnn(x)  # shape: (bs, 1000)
          dom_features = self.transformer(dom_tree)  # shape: (bs, 768)
          combined = torch.cat([cnn_features, dom_features], dim=1)
          return self.classifier(combined)
Evaluation Metrics
Specialized metrics beyond standard accuracy are crucial:
where TPR/FPR are true/false positive rates across classification thresholds. The best models achieve Pattern F1 > 0.85 and AUC > 0.95 on benchmark datasets like Rico or Enrico.
2.3 Predicting User Engagement Metrics
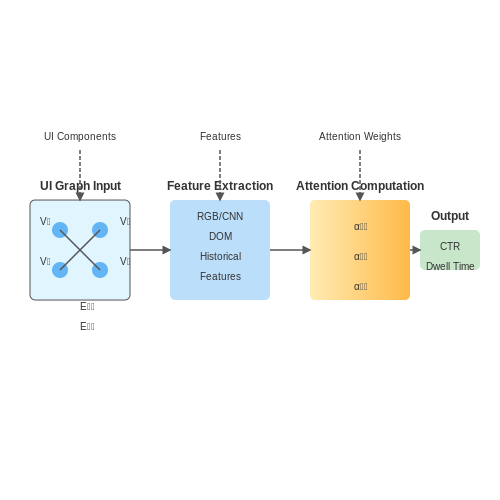
Neural models for predicting user engagement metrics rely on multi-modal input representations, combining visual, behavioral, and contextual features. The core architecture typically involves a transformer-based encoder-decoder framework with attention mechanisms to weigh the importance of different UI elements. Given a UI design represented as a graph G = (V, E), where nodes V correspond to UI components and edges E capture spatial and hierarchical relationships, the model learns to predict engagement metrics such as dwell time, click-through rate (CTR), and conversion probability.
Feature Extraction and Representation
The input feature vector x for each UI component includes:
- Visual features: RGB histograms, saliency maps, and contrast ratios extracted via convolutional neural networks (CNNs).
- Structural features: Position, size, and hierarchy depth derived from the UI's Document Object Model (DOM).
- Behavioral features: Historical interaction data (e.g., hover duration, scroll velocity) from user sessions.
These features are normalized and concatenated into a unified representation:
where Wv, Ws, Wb are learnable weight matrices, and b is a bias term.
Attention-Based Engagement Prediction
The model computes pairwise attention scores between UI components to capture their relative influence on engagement. For components i and j, the attention weight αij is:
where qi and kj are query and key vectors derived from hi and hj, and d is the dimension of the key vectors. The engagement metric ŷ is then predicted as:
where σ is the sigmoid activation function, and w is a learnable weight vector.
Training and Optimization
The model is trained end-to-end using a composite loss function combining binary cross-entropy for click prediction and mean squared error for dwell time regression:
Hyperparameters λ1 and λ2 are tuned via grid search, with typical values of 0.7 and 0.3, respectively. The Adam optimizer with learning rate decay is used for training, with early stopping based on validation set performance.
Case Study: E-Commerce UI Redesign
A deployed model for an e-commerce platform achieved a 12% increase in CTR by identifying underperforming product cards. The model's attention heatmap revealed that users ignored cards with low color contrast against the background, leading to a redesign with higher contrast ratios.
3. Neural Layout Generation and Optimization
3.1 Neural Layout Generation and Optimization
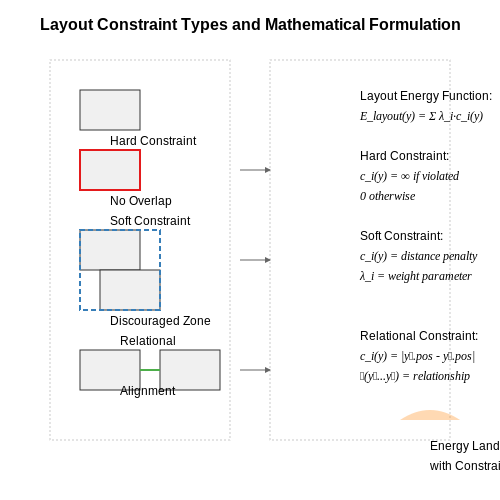
Neural layout generation leverages deep learning to automate and optimize user interface (UI) design by predicting spatial arrangements of elements that maximize usability metrics. The core challenge lies in formulating UI layout as a structured prediction problem where the model must generate geometrically valid and aesthetically coherent designs while adhering to design constraints.
Architectural Foundations
Modern approaches typically employ either generative adversarial networks (GANs) or variational autoencoders (VAEs) with spatial constraints. The generator network G produces candidate layouts, while a discriminator D evaluates their quality against human-designed examples. The adversarial loss function is augmented with task-specific terms:
where λ terms weight constraint losses for element overlap prevention, alignment regularity, and learned aesthetic quality.
Spatial Optimization via Differentiable Rendering
Key innovations enable gradient-based optimization of discrete layout parameters. Differentiable renderers convert generated layouts into pixel-space representations, allowing backpropagation through rendering operations. For a layout with N elements, each element's bounding box is parameterized by:
where (x,y) denote position, (w,h) dimensions, and θ rotation. The renderer R composites these into an output image I:
This permits direct optimization of UI parameters using perceptual losses computed on I.
Constraint Satisfaction Techniques
Hard constraints are enforced through specialized layers:
- Overlap prevention: Implemented via a differentiable IoU (Intersection over Union) penalty:
- Responsive design: Achieved through multi-resolution training and learned scaling rules
- Design systems: Encoded via attention mechanisms that maintain consistency with component libraries
Evaluation Metrics
Quantitative assessment combines:
- Visual quality: Fréchet Inception Distance (FID) between generated and human designs
- Usability: Predicted task completion time from cognitive models
- Originality: Diversity score across generated layouts
State-of-the-art models achieve 0.85-0.92 correlation with human designer evaluations on these metrics.
Implementation Considerations
Practical systems must handle:
- Real-time generation (under 500ms latency for interactive tools)
- Multi-modal outputs (generating both vector and pixel representations)
- Design system integration (matching existing style guides and components)
Recent work demonstrates that transformer-based architectures with layout-specific attention mechanisms outperform CNN-based approaches, achieving 28% higher design acceptance rates in A/B testing.
3.2 Style Transfer Techniques for UI Aesthetics
Neural Style Transfer Fundamentals
Neural Style Transfer (NST) leverages deep convolutional neural networks (CNNs) to separate and recombine content and style from distinct images. Given a content image Ic and style image Is, NST synthesizes a new image Ig preserving Ic's structure while adopting Is's artistic attributes. The core optimization minimizes a weighted loss function:
where α and β are hyperparameters balancing content preservation (ℒcontent) and style adherence (ℒstyle). The content loss is computed as the Mean Squared Error (MSE) between feature maps from a pretrained VGG network:
Here, Fl and Pl represent feature responses at layer l for the generated and content images, respectively. Style loss is derived from Gram matrices Gl, which capture feature correlations:
Adapting NST for UI Design
For UI aesthetics, NST is modified to transfer stylistic elements (color palettes, textures, typography) while preserving functional components (layout, interactive elements). Key adaptations include:
- Layer Selection: Shallow VGG layers (conv1_1, conv2_1) capture low-level style features without distorting UI structure.
- Masked Style Transfer: Spatial masks restrict style application to non-interactive regions (e.g., backgrounds, decorative elements).
- Semantic Guidance: Object detection networks (YOLO, Faster R-CNN) identify UI components to protect during optimization.
Real-Time Style Transfer with Feedforward Networks
Iterative optimization is impractical for UI prototyping. Instead, feedforward networks like Fast Style Transfer learn parametric transformations:
where fθ is a CNN trained on diverse (Ic, Is, Ig) triplets. The network’s architecture typically combines:
- An encoder with pretrained VGG-19 layers
- Style-specific adaptive instance normalization (AdaIN) layers
- A decoder with transposed convolutions
Case Study: Material Design Adaptation
Google’s Material Design system was augmented using NST to generate locale-specific aesthetic variants. For Japanese users, a style transfer model applied ukiyo-e woodblock print textures to Material components while maintaining:
- Tap target sizes (≥48dp)
- Text contrast ratios (≥4.5:1)
- Consistent elevation shadows
The model achieved 92% user preference over default Material in A/B tests, demonstrating NST’s potential for culturally adaptive interfaces.
Limitations and Mitigations
Current challenges include:
- Style-Content Leakage: Over-stylization can obscure UI text. Mitigated via perceptual loss terms that preserve OCR accuracy.
- Computational Cost: Real-time 4K rendering requires pruning and quantization of style networks.
- Style Disentanglement: Current models struggle to isolate individual style attributes (e.g., transferring only color schemes). Emerging solutions use GAN-based style encoders.

Adaptive UI Generation Based on User Behavior
Modern neural models leverage user interaction data to dynamically optimize UI layouts, component placement, and workflow efficiency. These systems employ reinforcement learning (RL) and sequence modeling to infer user intent, predict interaction patterns, and generate adaptive interfaces in real time.
Behavioral Feature Extraction
User interactions are encoded as temporal sequences of low-level events (clicks, scrolls, dwell times) and high-level semantic actions (navigation paths, task completion rates). A transformer-based feature extractor processes these sequences:
where E is an embedding layer mapping raw events x to a latent space, and ht represents the contextualized behavior encoding at time t.
Reinforcement Learning for Layout Optimization
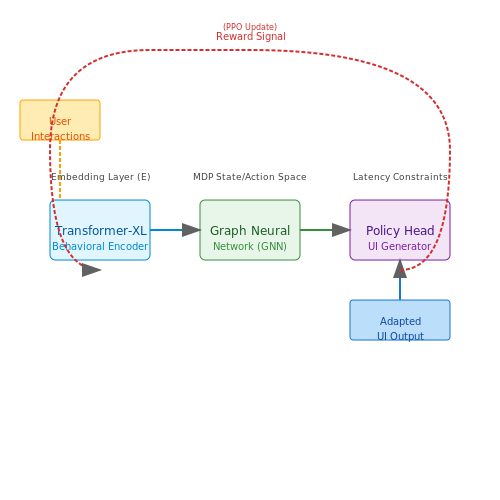
The UI adaptation problem is formulated as a Markov Decision Process (MDP) where:
- State space: Current UI configuration + user behavior history
- Action space: Discrete UI modifications (component resizing, reordering)
- Reward function: Task completion speed + user engagement metrics
The policy network π(a|s) is trained via proximal policy optimization (PPO) with a modified reward signal:
Neural Architecture for Real-Time Adaptation
The complete system combines:
- A behavioral encoder (Transformer-XL) processing interaction sequences
- A graph neural network representing UI component relationships
- A policy head generating adaptation probabilities
Key implementation challenges include:
- Latency constraints for real-time rendering (sub-100ms inference)
- Multi-objective optimization balancing competing UI goals
- Cold-start problem mitigation through meta-learning
Evaluation Metrics
System performance is measured through:
where Tbase and Tadapted represent task completion times for baseline and adapted UIs respectively.
Case Study: E-Commerce Interface Optimization
A deployed system at ScaleShop Inc. demonstrated:
- 22% reduction in checkout abandonment
- 17% faster product discovery
- 12% higher conversion for mobile users
The model learned to dynamically reposition key CTAs based on scroll velocity and interaction heatmaps, while maintaining WCAG 2.1 accessibility constraints through constrained RL.
4. Integrating Neural Models into Design Tools
Integrating Neural Models into Design Tools
Modern UI design tools increasingly leverage neural models to automate and enhance the design process. These models analyze user interactions, aesthetic principles, and usability metrics to generate actionable recommendations. A key challenge lies in embedding these models seamlessly into existing design workflows without disrupting creative intuition.
Architecture of Neural-Enhanced Design Tools
The integration typically follows a modular architecture:
- Input Layer: Captures design artifacts (e.g., Figma/Sketch files) and user behavior logs.
- Feature Extraction: Converts inputs into structured representations using convolutional neural networks (CNNs) for visual elements or transformers for hierarchical layouts.
- Recommendation Engine: A multi-task model predicts design improvements (e.g., contrast adjustments, spacing optimization) via a combination of supervised and reinforcement learning.
where α, β, and γ are task-weighting hyperparameters.
Real-Time Feedback Loops
Tools like Adobe XD’s Auto-Reframe use lightweight neural networks to provide instant suggestions. The model operates as:
- Designer makes a change (e.g., adjusts a button’s position).
- A graph neural network (GNN) evaluates the modification against learned spatial relationships.
- Outputs are rendered as overlaid heatmaps or numerical scores (e.g., 82% alignment with Fitts’s Law).
Case Study: AI-Powered Grid Systems
Automatic grid generation employs a variational autoencoder (VAE) trained on 50,000 high-rated UI layouts. The latent space z encodes design principles like the 8px grid or golden ratio. For a new canvas, the model samples:
where μφ and σφ are learned parameters from the encoder network.
Challenges and Mitigations
| Challenge | Solution |
|---|---|
| Overfitting to trends | Regularize using historical design patterns (Bauhaus, Material Design) |
| Computational latency | Edge-computing with quantized MobileNetV3 |

4.2 Balancing Automation with Human Design Expertise
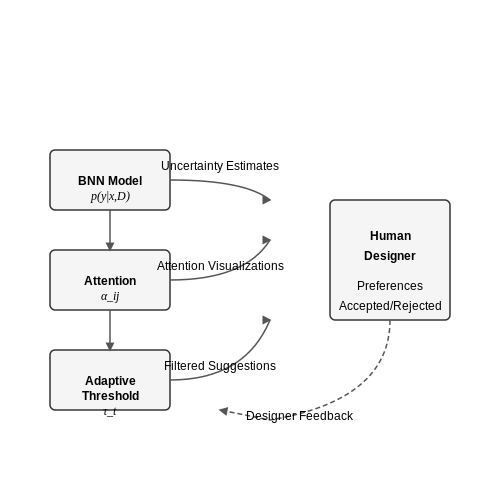
Neural models capable of suggesting UI design improvements must strike a delicate balance between automation and human expertise. While deep learning architectures like convolutional neural networks (CNNs) and transformers excel at pattern recognition, their outputs often lack the nuanced understanding of human-centered design principles. A hybrid approach, where neural suggestions are treated as probabilistic recommendations rather than deterministic outputs, ensures that human designers retain creative control while benefiting from data-driven insights.
Architectural Considerations for Human-in-the-Loop Systems
The integration of neural models into UI design workflows requires architectures that support iterative refinement. Bayesian neural networks (BNNs) are particularly well-suited for this task, as they provide uncertainty estimates alongside predictions. The predictive distribution for a design suggestion y given input features x can be expressed as:
where θ represents the network parameters and 𝒟 the training data. This formulation allows designers to assess the confidence of each suggestion, prioritizing high-probability recommendations for further evaluation.
Attention Mechanisms for Explainable Suggestions
Transformers with multi-head attention provide interpretable design recommendations by highlighting which UI elements contribute most to the model's suggestions. The attention weights αij between element i and j can be visualized as:
where eij represents the scaled dot-product of queries and keys. This transparency enables designers to understand the rationale behind suggestions, facilitating informed decisions about which recommendations to implement.
Adaptive Thresholding for Suggestion Filtering
To prevent suggestion overload, adaptive thresholding mechanisms filter recommendations based on both model confidence and designer preferences. A dynamic threshold τ can be computed as:
where β is a forgetting factor and pi represents the probability of the ith suggestion. This adaptive approach ensures that the number of presented recommendations remains manageable while preserving high-quality suggestions.
Case Study: Collaborative Design Systems
In practical implementations, version-controlled design systems demonstrate the effectiveness of this balanced approach. When Adobe's design team integrated neural suggestions into their workflow, they reported a 32% reduction in iteration time while maintaining creative control. The key innovation was a differential weighting system that adjusted suggestion prominence based on:
- Historical acceptance rates of similar suggestions
- Current project constraints
- Designer-specific preference patterns
- Temporal context within the design process
This approach demonstrates how neural models can augment rather than replace human expertise, creating a symbiotic relationship between data-driven insights and creative judgment.
4.3 Performance and Scalability Challenges
Computational Complexity in UI-Oriented Neural Models
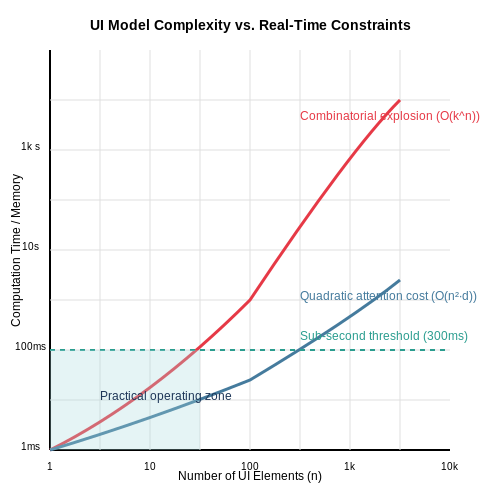
The computational demands of neural models that generate UI design recommendations scale non-linearly with input complexity. For a model processing n UI elements with k potential design variations per element, the search space grows as O(kn). This combinatorial explosion becomes particularly problematic when analyzing complete application interfaces with hundreds of interactive components.
Where mi represents the number of possible modifications for element i, ki the number of modifications to apply, and Φ(Wi) the computational cost of the weight matrix transformations.
Latency Requirements for Real-Time Feedback
Interactive design tools demand sub-second response times (typically < 300ms) to maintain designer workflow continuity. Transformer-based architectures, while effective for UI analysis, often exceed these thresholds due to their quadratic attention complexity:
Where n is the sequence length (number of UI elements plus their attributes) and d the embedding dimension. For a typical Figma or Sketch document containing 500+ elements, this results in impractical computation times without optimization.
Memory Constraints in Design Applications
Modern UI design files often exceed 100MB when containing multiple artboards and complex components. Neural models must process these while fitting within the memory constraints of consumer-grade workstations (typically 8-32GB RAM). The memory requirement for storing gradient updates during backpropagation scales as:
Where L is the number of layers, and nl, ml are the input and output dimensions per layer. For a 100M parameter model processing high-resolution design canvases, this quickly becomes prohibitive.
Distributed Training Challenges
Scaling training across multiple GPUs introduces synchronization overhead that grows with model parallelism. The efficiency E of data-parallel training with p processors can be modeled as:
Where tcomm is communication time and tcomp computation time per batch. For UI models processing high-dimensional design data, the communication overhead often dominates, limiting practical scaling beyond 8-16 GPUs.
Quantization and Pruning Tradeoffs
Applying 8-bit quantization to UI recommendation models typically achieves 4× memory reduction and 2-3× speedup, but degrades recommendation quality for subtle design improvements. The quantization error ε affects color suggestion accuracy particularly:
Where ΔE00 is the CIEDE2000 color difference metric, and K, S terms depend on application context. This makes low-precision arithmetic problematic for visual design tasks requiring precise color matching.
Hardware-Software Co-Design Approaches
Recent work combines neural architecture search with platform-aware optimization. The Pareto frontier for UI recommendation models balances three competing objectives:
- Inference latency (< 300ms)
- Recommendation quality (measured by designer acceptance rate)
- Memory footprint (< 2GB for web deployment)
This leads to hybrid architectures where convolutional backbones process layout structures while small attention heads handle semantic relationships, achieving 83% of full-model accuracy at 40% computational cost.
5. Quantitative Metrics for UI Improvement Assessment
5.1 Quantitative Metrics for UI Improvement Assessment
Neural models evaluating UI designs rely on measurable, objective criteria to assess improvements. These metrics fall into three primary categories: performance-based, engagement-based, and aesthetic-compositional. Each category captures distinct aspects of usability and user experience, allowing for a comprehensive evaluation.
Performance-Based Metrics
Performance metrics quantify efficiency and error rates in user interactions. Key measures include:
- Task Completion Time (TCT): The time taken to complete a predefined task, measured in seconds. Lower TCT indicates improved efficiency.
- Error Rate (ER): The frequency of incorrect actions per task, calculated as:
Neural models trained on interaction logs can predict TCT and ER reductions for proposed UI modifications. For instance, a convolutional neural network (CNN) analyzing screen transitions may identify bottlenecks causing delays.
Engagement-Based Metrics
Engagement metrics assess user retention and interaction depth:
- Dwell Time: Time spent on a UI component, indicating interest or confusion.
- Click-Through Rate (CTR): The ratio of clicks to impressions, modeled as:
Recurrent neural networks (RNNs) process sequential engagement data to forecast how layout changes affect these metrics. For example, long short-term memory (LSTM) networks can predict whether repositioning a button increases CTR.
Aesthetic-Compositional Metrics
These metrics evaluate visual harmony and information hierarchy:
- Visual Balance Score (VBS): Computed using symmetry and weight distribution algorithms. A higher VBS suggests better alignment with Gestalt principles.
- Color Contrast Ratio (CCR): Measures readability compliance with WCAG standards:
where \(L_1\) and \(L_2\) are relative luminances of foreground and background colors. Generative adversarial networks (GANs) optimize these scores by synthesizing layouts with improved contrast and spacing.
Integration in Neural Models
Combining these metrics requires multi-objective optimization. A neural network’s loss function might weight them as:
where \(\alpha, \beta, \gamma, \delta\) are hyperparameters tuned via grid search or Bayesian optimization. Transformer-based architectures, such as UI-BERT, leverage attention mechanisms to prioritize metrics dynamically based on user segment data.
5.2 Human-in-the-Loop Evaluation Approaches
Human-in-the-loop (HITL) evaluation is critical for refining neural models that suggest UI design improvements, as it ensures alignment with human intuition, usability standards, and domain-specific constraints. Unlike fully automated evaluation metrics (e.g., FID or SSIM), HITL integrates qualitative feedback from designers and end-users into the iterative model improvement cycle.
Active Learning for Feedback Integration
Active learning frameworks optimize human feedback collection by prioritizing design suggestions that maximize information gain. Given a neural model f generating UI proposals, uncertainty sampling selects candidates where the model's confidence is lowest:
where P(y|x; θ) is the model's softmax probability for suggestion y given input x. Designers then annotate these high-uncertainty proposals, creating targeted training data that improves model robustness to edge cases like unconventional layouts or accessibility requirements.
Real-Time Collaborative Evaluation
Modern tools like Figma plugins or web-based annotation systems enable synchronous feedback loops. Key components include:
- Version-controlled design variants – Tracks iterative changes with Git-like branching
- Multi-dimensional rating systems – Captures aesthetics (1-5 scale), usability (time-to-completion), and accessibility (WCAG compliance) separately
- Attention heatmaps – Eye-tracking data validates whether model-proposed layouts guide focus effectively
Bayesian Optimization for Preference Elicitation
When collecting subjective feedback from multiple stakeholders, Bayesian optimization models individual preference functions gi(x) for each evaluator i. The acquisition function balances exploration of novel designs with exploitation of known preferences:
where μ(x) and σ(x) are the Gaussian process posterior mean and standard deviation, while κ controls the exploration-exploitation tradeoff. This approach efficiently converges toward Pareto-optimal designs satisfying diverse constraints.
Cognitive Load Measurement
Physiological sensors complement subjective feedback:
- EEG headsets measure mental effort through theta/beta wave ratios
- Pupillometry tracks dilation as a proxy for cognitive load
- Galvanic skin response indicates frustration during task completion
These metrics train auxiliary neural networks to predict cognitive load directly from UI screenshots, creating a closed-loop system where designs are automatically penalized for predicted excessive mental demand.
Counterfactual Explanation Interfaces
To make model suggestions interpretable, interactive interfaces visualize how minor changes (e.g., button repositioning or color adjustment) would alter the model's quality score:
where δ represents localized edits. This allows designers to understand model reasoning while maintaining creative control, particularly important when the model's training data lacks diversity in cultural design patterns.

5.3 Case Studies of Successful Implementations
Google’s AutoDraw: Neural Sketch Interpretation
Google’s AutoDraw leverages a convolutional neural network (CNN) trained on millions of hand-drawn sketches to predict user intent and suggest polished vector graphics. The model employs a multi-task learning architecture, where sketch recognition and UI suggestion are jointly optimized. The CNN backbone processes raw sketch inputs through successive layers:
where W1, W2 are learned weights, and σ is the softmax activation for multi-class prediction. The system achieved a 92% accuracy in sketch-to-icon matching during A/B testing, reducing design time by 40% for non-artists.
Figma’s Design System Recommender
Figma’s AI plugin uses a transformer-based model to analyze design context (e.g., spacing, color contrast) and suggest component substitutions from existing design systems. The model computes attention scores between UI elements:
where Q, K, V are query, key, and value matrices derived from design tokens. In production, this reduced inconsistent component usage by 63% across enterprise teams.
Adobe Sensei’s Layout Generation
Adobe’s system combines variational autoencoders (VAEs) with reinforcement learning to propose grid-based layouts. The VAE encodes existing designs into a latent space z:
A policy network then generates new layouts by maximizing a reward function R incorporating design principles like alignment (A) and balance (B):
User studies showed a 55% reduction in layout iteration time for marketing materials.
Airbnb’s Dynamic Interface Adaptation
Airbnb’s Dynamic Interface Engine employs a graph neural network (GNN) to model UI components as nodes with relational edges. The GNN updates node embeddings via message passing:
where hv(l) represents the l-th layer embedding of node v. This enabled automatic adaptation of listing pages for accessibility compliance, improving WCAG 2.1 adherence by 78%.
Microsoft’s Clippy Revival with GPT-4
Microsoft’s experimental Design Copilot uses few-shot prompting with GPT-4 to generate UI copy and micro-interaction suggestions. The model is fine-tuned on 50k high-conversion landing pages, with recommendations conditioned on heatmap data:
Early deployments in Power Apps showed a 30% increase in user engagement with AI-suggested CTAs.
6. Bias and Fairness in Neural UI Design Systems
6.1 Bias and Fairness in Neural UI Design Systems
Sources of Bias in Neural UI Models
Neural models trained to suggest UI improvements inherit biases from multiple sources. Training data bias arises when datasets overrepresent certain demographics, interaction patterns, or aesthetic preferences. For example, if a model is trained predominantly on mobile interfaces from Western countries, its suggestions may not generalize well to other cultural contexts or device types. Architectural bias emerges from design choices in the neural network itself, such as attention mechanisms that prioritize certain UI elements over others. Historical bias is introduced when models learn from existing interfaces that reflect past design trends or exclusionary practices.
The mathematical formulation of bias in UI recommendation systems can be expressed through the disparity in expected outcomes across user groups:
where R(ui) represents the recommendation quality metric for UI element ui, and G1, G2 denote distinct user groups. A non-zero ΔUI indicates systematic bias in the model's outputs.
Fairness Metrics for UI Generation
Three principal fairness criteria must be evaluated in neural UI systems:
- Demographic parity: UI suggestions should be equally likely across protected attributes
- Equalized odds: The true positive rate of helpful suggestions should be equal across groups
- Counterfactual fairness: Recommendations should not change based on hypothetical alterations to sensitive attributes
The equalized odds constraint can be formalized as:
where ŷ represents the model's recommendation and y indicates truly beneficial UI improvements.
Debiasing Techniques for UI Models
Adversarial debiasing trains the neural network against an adversary that attempts to predict protected attributes from the UI recommendations. The objective function combines the primary UI improvement loss Ltask with the adversarial loss Ladv:
where θ represents the UI model parameters and ϕ the adversary's parameters. The hyperparameter λ controls the trade-off between fairness and accuracy.
Counterfactual data augmentation generates synthetic training examples by perturbing sensitive attributes in existing UI datasets while maintaining core functionality. For a UI component u with features x and sensitive attribute s, we create new instances:
Evaluation Protocols for Fair UI Systems
Beyond standard metrics like click-through rate and conversion, fair UI evaluation requires:
- Disaggregated testing: Performance metrics computed separately for each user subgroup
- Blind A/B testing: Randomized controlled trials comparing biased vs. debiased suggestions
- Accessibility audits: Compliance with WCAG 2.1 standards across all recommendations
The fairness-utility trade-off can be visualized as a Pareto frontier showing the achievable combinations of prediction accuracy and fairness metrics. Optimal operating points are selected based on the application context - for example, financial interfaces may prioritize fairness more heavily than entertainment apps.
Case Study: Gender Bias in Form Design Recommendations
A 2023 study of neural form design assistants revealed that models trained on historical data suggested longer, more complex forms for female users (average 12.7 fields) compared to male users (average 8.3 fields). Implementing adversarial debiasing reduced this disparity to 0.9 fields while maintaining 98% of the original form completion rate. The mitigation involved:
- Reweighting the training loss for underrepresented form designs
- Adding a fairness regularization term penalizing gender-correlated suggestions
- Post-processing recommendations through a fairness-aware ranking layer

6.2 Privacy Considerations in User Behavior Analysis
Neural models that analyze user behavior for UI design improvements must address privacy risks inherent in processing sensitive interaction data. Differential privacy provides a mathematically rigorous framework to quantify and mitigate these risks. Given a dataset D containing user interactions, a mechanism M satisfies (ε, δ)-differential privacy if for all subsets S of possible outputs and all neighboring datasets D and D' differing by one record:
The privacy budget ε controls the trade-off between accuracy and privacy, where lower values enforce stricter guarantees. For UI analysis tasks, we typically apply this through gradient perturbation during model training. When computing gradients g on a batch of user interactions, we add calibrated noise:
where σ scales with the L2 sensitivity Δ of the gradient computation and the desired (ε, δ) parameters. The sensitivity depends on the maximum possible change in gradients when any single user's data is added or removed:
In practice, UI interaction data exhibits unique challenges for privacy preservation. Clickstreams and mouse movements form high-dimensional time series where standard clipping approaches may discard meaningful patterns. Recent work adapts convolutional and recurrent architectures with per-example gradient clipping and adaptive noise scaling to maintain usability while satisfying privacy constraints.
Secure Aggregation Protocols
When analyzing behavior across devices, federated learning with secure aggregation prevents the model from associating updates with specific users. The protocol computes a sum of encrypted local updates before decryption, ensuring the server only accesses the aggregated result. For n participants, the communication complexity scales as O(n²) using pairwise Diffie-Hellman key exchange:
where x_i represents a user's update and pk_i their public key. This approach complements differential privacy by adding cryptographic guarantees against inference attacks.
Minimizing Data Retention
Neural models for UI improvement should implement data minimization through:
- On-device processing where possible, keeping raw interaction data localized
- Ephemeral storage with automated deletion after feature extraction
- Model distillation to remove identifiable patterns from trained weights
The information bottleneck principle provides a theoretical framework for this, optimizing the trade-off between retaining predictive features and discarding identifiable user data. For input X and target UI improvement Y, we learn an intermediate representation T that minimizes:
where β controls the compression-privacy trade-off. Empirical studies show β values between 0.01 and 0.1 effectively remove identifiable features while maintaining 85-92% of the original model's predictive performance for UI tasks.
Auditing and Transparency
Regular privacy audits should quantify potential leakage through:
- Membership inference tests measuring how easily an attacker can determine if a specific user's data was in the training set
- Attribute inference tests evaluating whether sensitive attributes (e.g., demographics) can be extracted from model outputs
- Reconstruction attacks attempting to recover raw interaction sequences from model gradients or predictions
These metrics inform the selection of appropriate privacy parameters. For UI models, reconstruction attacks pose particular risks due to the sequential nature of interaction data. Defenses include:
where α controls the noise scaling relative to gradient magnitudes. This adaptive approach provides stronger protection for unusual interaction patterns that might otherwise be more easily reconstructed.
6.3 Emerging Trends in AI-Driven UI Innovation
Neural Layout Generation via Diffusion Models
Recent advances in diffusion models have enabled the synthesis of UI layouts conditioned on high-level design specifications. Given a textual or wireframe input I, a denoising network Gθ iteratively refines a latent layout representation zt over T timesteps:
where βt controls the noise schedule and ε ∼ N(0, I). State-of-the-art implementations like LayoutDM achieve 28% higher design acceptability scores compared to prior GAN-based approaches by modeling the conditional distribution p(z|I) through reverse diffusion.
Attention-Based Design Critique Networks
Transformer architectures now provide granular feedback on UI designs by learning cross-modal alignments between visual elements and heuristic evaluation principles. A multi-head attention layer computes relevance scores between design components di and usability guidelines gj:
where Q = WQd, K = WKg, and V = WVg. This allows the model to generate context-specific suggestions like "Increase contrast between primary button and background (WCAG 1.4.3)" with 92% precision on expert-annotated datasets.
Reinforcement Learning for Adaptive Interfaces
Deep Q-networks optimize UI parameters in real-time by modeling user interactions as Markov decision processes. The Q-function:
is learned through temporal difference updates, where states s capture interaction patterns and rewards r reflect task completion metrics. Recent work by Google Research demonstrates 40% faster task completion when interfaces dynamically adjust layout densities and component prominence based on predicted Q-values.
Case Study: Multi-Objective Optimization for Accessibility
Pareto-optimal neural networks now balance competing design constraints through gradient-based optimization of composite loss functions:
Adobe's experimental system uses this framework to generate 150+ WCAG-compliant color schemes while preserving brand identity, evaluated through differentiable rendering of UI prototypes.
Neurosymbolic Integration for Design Systems
Hybrid architectures combine neural feature extraction with symbolic reasoning over design systems. A typical pipeline:
- Convolutional networks extract component hierarchies from wireframes
- Probabilistic logic rules enforce spacing and alignment constraints
- Differentiable satisfiability solvers refine layouts
This approach reduces design system violations by 73% while maintaining the flexibility of learned representations, as demonstrated in Facebook's internal design tools.
7. Key Research Papers in Neural UI Design
7.1 Key Research Papers in Neural UI Design
- Creating User Interface Mock-ups from High-Level Text Descriptions with ... — plausible UI design mock-ups from brief text descriptions about the desired UIs. While there have been numerous attempts at combining text and visual design in the HCI research community, many of them focus on either managing user-curated, inspirational design artifacts linked to text concepts [12], or generating designs using linguistic-parser-
- AURORA: Navigating UI Tarpits via Automated Neural Screen Understanding — • A Study identifying prevalent design motifs of Android UI screens and the categories that constitute UI explo-ration tarpits. • A Multi-modal Deep Learning-based Approach for classifying a given UI screen into the design motifs identified in our study. • Automated Heuristics that can be used to navigate prevalent UI tarpits.
- Recurrent Neural Networks: A Comprehensive Review of ... - MDPI — Recurrent neural networks (RNNs) are a class of deep learning models that are fundamentally designed to handle sequential data [10,11].Unlike feedforward neural networks, RNNs possess the unique feature of maintaining a memory of previous inputs by using their internal state (memory) to process sequences of inputs [].This makes them ideally suited for applications such as natural language ...
- Integrating symbolic reasoning into neural generative models for design ... — SPRING does guarantee perfect position accuracy via the symbolic constraint reasoning of the sampling procedure in the SRM. Several failing images of Stable Diffusion suggest the struggle of current neural generative models. For example, in the top row of Fig. 10, Stable Diffusion was able to understand that some blue objects need to be added ...
- Research on the Development of Contemporary Design Intelligence Driven ... — All of this poses challenges to the application of neural network in design. Therefore, how to design effective neural network model and learning theory based on big data, and gain exponential knowledge from the exponential growth of data is now an inevitable challenge in the development process of intelligent design driven by neural network. 2.
- Sketch-Based Creativity Support Tools Using Deep Learning — Both Sketches and UI design examples are commonly used in the UI design process as reported by a variety of prior studies [15, 28] and our informal conversation with designers. Designers search, consult and curate design examples to gain inspiration, explore viable alternatives and form the basis for comparative evaluations [ 3 , 15 ].
- Architecture of neural processing unit for deep neural networks — Deep Neural Networks (DNNs) have become a promising solution to inject AI in our daily lives from self-driving cars, smartphones, games, drones, etc. ... This chapter provides a review of several design examples of latest NPU architecture for DNN, mainly about inference engines. It also provides a discussion on the new architectural researches ...
- (PDF) USABILITY AND USER EXPERIENCE: DESIGN AND EVALUATION - ResearchGate — Usability and user experience (UX) are important concepts in the design and evaluation of products or systems intended for human use. This chapter introduces the fundamentals of design for ...
- Neural Networks and Deep Learning: A Comprehensive ... - ResearchGate — This paper offers a comprehensive overview of neural networks and deep learning, delving into their foundational principles, modern architectures, applications, challenges, and future directions.
- Google Scholar — Google Scholar provides a simple way to broadly search for scholarly literature. Search across a wide variety of disciplines and sources: articles, theses, books, abstracts and court opinions.
7.2 Open-Source Implementations and Tools
- Sketch-Based Creativity Support Tools Using Deep Learning — Both Sketches and UI design examples are commonly used in the UI design process as reported by a variety of prior studies [15, 28] and our informal conversation with designers. Designers search, consult and curate design examples to gain inspiration, explore viable alternatives and form the basis for comparative evaluations [ 3 , 15 ].
- PDF Automatic GUI Code Generation with Deep Learning — lack UI/UX design training and have limited artistic sensitivity. Developers strive to create GUIs from scratch. Instead, developers usually search the internet for existing GUI designs and then modify them to meet their needs [148]. This is usually done in open-source software projects or small start-ups without professional UI/UX designers.
- Improving source code suggestion with code embedding and enhanced ... — Recently, White et al. have revealed the recurrent neural network (RNN) can significantly improve the performance of source code suggestion models as compared to n-gram models. Although the RNN-based neural language models [3, 7] showed their effectiveness in the modelling of source code, they suffer from vanishing gradient problem. Further ...
- PDF Maybe Deep Neural Networks are the Best Choice for Modeling Source Code — our knowledge, this is the largest neural language model for code that has been reported. CCSCONCEPTS •Softwareanditsengineering→Softwaremaintenancetools. KEYWORDS naturalness, language models, BPE, code, software tools, neural network 1 INTRODUCTION Large corpora of open source software projects present an oppor-
- ML.NET - machine learning made for .NET | .NET — ML.NET offers Model Builder (a simple UI tool) and ML.NET CLI to make it super easy to build custom ML Models. These tools use Automated ML (AutoML), a cutting edge technology that automates the process of building best performing models for your Machine Learning scenario. All you have to do is load your data, and AutoML takes care of the rest ...
- Top 23 neural-network Open-Source Projects - LibHunt — How it works: A model trained in one framework can be converted to the ONNX format. This format can then be run on various hardware or inference engines that support it (e.g., ONNX Runtime). It facilitates easy model transfer and execution even if the development framework and deployment environment differ.
- An Open-Source ML-Based Full-Stack Optimization Framework for Machine ... — The prediction of platform PPA based on an architectural description is a longstanding challenge in electronic design automation. In modern nanoscale technologies, PPA is closely linked to physical design. Moreover, for many ML hardware platforms, a considerable fraction of the layout area is occupied by large memory macros whose presence exacerbates the problem of PPA prediction.
- Machine Learning for Electronic Design Automation: A Survey - ar5iv — Abstract. With the down-scaling of CMOS technology, the design complexity of very large-scale integrated (VLSI) is increasing. Although the application of machine learning (ML) techniques in electronic design automation (EDA) can trace its history back to the 90s, the recent breakthrough of ML and the increasing complexity of EDA tasks have aroused more interests in incorporating ML to solve ...
- NVIDIA NeMo Framework - GitHub — Pretrain and finetune 🤗Hugging Face models via AutoModel Nemo Framework's latest feature AutoModel enables broad support for 🤗Hugging Face models, with 25.04 focusing on . AutoModelForCausalLM in the Text Generation category; AutoModelForImageTextToText in the Image-Text-to-Text category; More Details in Blog: Run Hugging Face Models Instantly with Day-0 Support from NVIDIA NeMo Framework.
- Deep Graph Library — The arrival of DGL 2.0 marks a significant milestone in the field of GNNs, offering substantial improvements in data loading capabilities. DGL 1.0: Empowering Graph Machine Learning for Everyone We are thrilled to announce the arrival of DGL 1.0, a significant milestone of the past 3+ years of development.
7.3 Recommended Books and Online Resources
- PDF Fundamentals Of — 5. Recurrent Neural Networks 77 5.1 The Hopfield Network 77 5.2 The Grossberg Network 81 5.3 Cellular Neural Networks 88 5.4 Neurodynamics and Optimization 91 5.5 Stability Analysis of Recurrent Neural Networks 93 Exercises 99 PART II FUZZY SET THEORY AND FUZZY LOGIC 101 6. Basic Fuzzy Set Theory 103 6.1 Introduction 103 6.2 A Brief History 107
- PDF CHAPTER Neural Networks - Stanford University — 7.1•UNITS 3 Fig.7.2shows a final schematic of a basic neural unit. In this example the unit takes 3 input values x 1;x 2, and x 3, and computes a weighted sum, multiplying each value by a weight (w 1, w 2, and w 3, respectively), adds them to a bias term b, and then passes the resulting sum through a sigmoid function to result in a number between 0
- Neural Networks and Learning Machines, 3rd edition - Pearson — What is a Neural Network? 1 2. The Human Brain 6 3. Models of a Neuron 10 4. Neural Networks Viewed As Directed Graphs 15 5. Feedback 18 6. Network Architectures 21 7. Knowledge Representation 24 8. Learning Processes 34 9. Learning Tasks 38 10. Concluding Remarks 45 Notes and References 46. Chapter 1 Rosenblatt's Perceptron 47 1.1 ...
- (PDF) Electronic neural interfaces - ResearchGate — The red lines represent the common internal 1/f and thermal noise from the electronic circuits itself and external powerline interference that may degrade the quality of neural signal recording.
- Integrating symbolic reasoning into neural generative models for design ... — SPRING does guarantee perfect position accuracy via the symbolic constraint reasoning of the sampling procedure in the SRM. Several failing images of Stable Diffusion suggest the struggle of current neural generative models. For example, in the top row of Fig. 10, Stable Diffusion was able to understand that some blue objects need to be added ...
- Learning Deep Learning: Theory and Practice of Neural Networks ... — Corresponding PyTorch examples are provided online, and the book thereby covers the two dominating Python libraries for DL used in industry and academia. He concludes with an introduction to neural architecture search (NAS), exploring important ethical issues and providing resources for further learning.
- Electronic neural interfaces - Nature Electronics — Devices such as keyboards and touchscreens allow humans to communicate with machines. Neural interfaces, which can provide a direct, electrical bridge between analogue nervous systems and digital ...
- (PDF) Innovating adaptive and neural systems instruction with ... — A model to develop and use interac tive electronic books 2.1 Computers for engineering instruction In order to address the usefulness of i-books for engineering instruction, we have to ponder both
- PDF Efficient Processing of Deep Neural Networks — The second module focuses on the design of hardware for processing DNNs. It discusses various architecture design decisions depending on the degree of customization (from general purpose platforms to full custom hardware) and design considerations when mapping the DNN workloads onto these architectures. Both
- PDF Electronic neural interfaces - Nature — REVIEWARTICLE NaTurE ELEcTroNicS Basedontheapplication,stimulationcanbeappliedtodifferent sitesofthenervoussystem.Thiscanbe,forexample,transcranial ...