Deforestation Detection from Satellite Imagery
1. Key Definitions: Deforestation vs. Forest Degradation
1.1 Key Definitions: Deforestation vs. Forest Degradation
Deforestation and forest degradation are distinct but interrelated processes affecting forest ecosystems. Deforestation refers to the permanent removal of forest cover and conversion of land to non-forest uses, such as agriculture, urban development, or mining. In contrast, forest degradation describes a reduction in forest quality—including biodiversity loss, soil erosion, or diminished carbon storage—without a complete loss of forest area.
Quantitative Distinctions
The Food and Agriculture Organization (FAO) defines deforestation as a land-use change where tree canopy cover falls below 10% over an area ≥ 0.5 hectares. Forest degradation, however, is measured through indicators like:
- Reduction in biomass density (Mg/ha)
- Decline in canopy cover percentage
- Loss of keystone species
where ΔB is biomass loss between time intervals t0 and t1. Degradation often shows ΔB > 0 but with persistent canopy cover above the 10% threshold.
Spectral Signatures in Remote Sensing
Multispectral satellite data (e.g., Landsat, Sentinel-2) captures these phenomena differently:
- Deforestation: Sharp declines in NDVI (Normalized Difference Vegetation Index) with transitions to non-vegetation spectral profiles.
- Degradation: Gradual NDVI reduction or increased soil exposure indices (e.g., SAVI, Soil-Adjusted Vegetation Index).
Case Study: Amazon Basin
In the Brazilian Amazon, deforestation appears as geometric, cleared patches in MODIS imagery, while degradation manifests as fragmented canopies from selective logging. LiDAR studies show degraded forests retain 40–70% of original biomass but lose critical ecological functions.
Operational Implications for ML Models
Convolutional neural networks (CNNs) trained on deforestation detection often fail to identify degradation without:
- Time-series analysis (e.g., using LSTMs)
- Higher-resolution data (≤10m/pixel)
- Ancillary data layers (e.g., radar, LiDAR)

Importance of Satellite Imagery in Environmental Monitoring
Satellite imagery provides a unique vantage point for monitoring environmental changes at global, regional, and local scales. Unlike ground-based surveys, which are labor-intensive and spatially limited, satellites offer consistent, high-resolution data with temporal regularity. The spectral bands captured by multispectral and hyperspectral sensors enable the detection of subtle changes in vegetation health, land cover, and moisture content—critical for deforestation analysis.
Spectral Indices for Vegetation Monitoring
Vegetation indices derived from satellite imagery quantify photosynthetic activity and biomass. The Normalized Difference Vegetation Index (NDVI) is the most widely used metric, calculated as:
where NIR and Red represent reflectance in the near-infrared and red spectral bands, respectively. NDVI values range from -1 to 1, with healthy vegetation typically above 0.6. Advanced indices like the Enhanced Vegetation Index (EVI) and Soil-Adjusted Vegetation Index (SAVI) account for atmospheric and soil interference:
Here, G is a gain factor, C1 and C2 are atmospheric correction coefficients, and L is a canopy background adjustment term.
Temporal Resolution and Change Detection
Satellites like Landsat (16-day revisit) and Sentinel-2 (5-day revisit) enable time-series analysis to identify deforestation events. Pixel-based change detection algorithms compare spectral signatures across dates. The Mann-Kendall trend test statistically evaluates monotonic changes in vegetation indices over time:
where sgn is the sign function, and xi, xj are sequential observations. A significant negative trend (p < 0.05) indicates potential deforestation.
Spatial Resolution Requirements
Deforestation detection demands a balance between spatial detail and coverage area. High-resolution sensors like WorldView (0.3 m/pixel) identify individual tree removal but suffer from limited swath width. Medium-resolution systems like Landsat (30 m/pixel) provide continental coverage but may miss small-scale clearing. The optimal resolution depends on the target deforestation driver:
- Industrial logging: ≥ 10 m/pixel
- Smallholder agriculture: ≤ 5 m/pixel
- Forest degradation: ≤ 30 m/pixel with radar augmentation
Data Fusion Techniques
Combining optical and synthetic aperture radar (SAR) data improves detection reliability, especially in cloud-prone regions. Polarimetric SAR (PolSAR) measures forest structure through backscatter coefficients:
where Shh and Svv are horizontal and vertical polarization scattering matrices. A decrease in σ0 > 3 dB often corresponds to canopy loss.
Operational Monitoring Systems
Global Forest Watch employs Landsat data with the Hansen et al. (2013) algorithm to map annual forest loss at 30 m resolution. The system detects deforestation with 87.3% producer accuracy by thresholding cumulative NDVI anomalies. Near-real-time systems like RADD (Radar for Deforestation Detection) use Sentinel-1 C-band SAR to achieve weekly updates with 92% detection probability for clearings > 0.5 ha.

1.3 Temporal and Spatial Resolution Requirements
The effectiveness of deforestation detection systems depends critically on the temporal and spatial resolution of satellite imagery. These parameters determine both the minimum detectable change and the frequency at which such changes can be observed.
Spatial Resolution Constraints
Spatial resolution defines the smallest distinguishable feature in an image, typically measured in meters per pixel. For deforestation monitoring, the required resolution depends on the scale of targeted disturbances:
- Large-scale clear-cutting: 10-30m resolution (Landsat, Sentinel-2)
- Selective logging: 1-5m resolution (PlanetScope, WorldView)
- Forest degradation: Sub-meter to 5m resolution (IKONOS, QuickBird)
The relationship between detectable tree canopy loss and pixel size can be modeled as:
where Pd is the detection probability, λ is the tree density (stems/m²), and Ap is the pixel area. For reliable detection (Pd > 0.9) in tropical forests with λ ≈ 0.05 stems/m², pixel sizes below 10m are typically required.
Temporal Resolution Requirements
Temporal resolution (revisit time) must balance detection latency with data volume constraints. Key considerations include:
- Forest regrowth rates (months to years)
- Illegal logging activity patterns (often weekly to monthly)
- Cloud cover obstructions (particularly in tropical regions)
The optimal revisit period Δt can be derived from change detection theory:
where Pc is the desired probability of capturing a deforestation event and r is the event rate (events/day). For Pc = 0.95 and r = 0.1 (typical in protected areas), Δt ≈ 30 days.
Sensor Fusion Approaches
No single satellite system provides both high spatial and temporal resolution. Modern solutions combine:
- High-cadence, moderate-resolution: Sentinel-2 (5-day revisit, 10m)
- Low-cadence, high-resolution: WorldView (1.5-day revisit, 0.3m)
- Synthetic aperture radar: Sentinel-1 (6-day revisit, 5m) for cloud penetration
The fusion process involves spatiotemporal alignment through:
where weights wk account for sensor-specific uncertainties and (x',y',t') are transformed coordinates in a common reference frame.
Operational Constraints
Practical implementations must consider:
- Data downlink bandwidth limitations
- Computational costs of high-resolution processing
- Orbital mechanics constraints on revisit times
The ground sampling distance (GSD) requirement for a given orbit height h and detector pitch p is:
where f is the focal length. For h = 700km (typical LEO orbit) and p = 10μm, achieving 1m GSD requires f ≈ 7m - a significant engineering challenge.

2. Overview of Satellite Platforms (Landsat, Sentinel, MODIS)
Overview of Satellite Platforms (Landsat, Sentinel, MODIS)
Satellite platforms for Earth observation provide multispectral and temporal data critical for deforestation detection. Three key systems—Landsat, Sentinel, and MODIS—offer complementary capabilities in spatial resolution, spectral bands, and revisit frequency.
Landsat Series
The Landsat program, operational since 1972, is the longest-running Earth observation initiative. Landsat 8 and 9 provide 30-meter spatial resolution across 11 spectral bands, including visible, near-infrared (NIR), shortwave infrared (SWIR), and thermal infrared (TIR). The SWIR bands (Band 6: 1.57–1.65 µm; Band 7: 2.11–2.29 µm) are particularly effective for detecting vegetation stress and burned areas. The radiometric resolution of 12 bits enables finer discrimination of land cover changes. The 16-day revisit cycle ensures regular monitoring, though cloud cover can limit effective temporal resolution in tropical regions.
Sentinel-2 (Copernicus Program)
Sentinel-2A and 2B, part of the European Union's Copernicus program, offer higher spatial resolution (10–60 m) with a 5-day revisit when both satellites are operational. The 13 spectral bands include four vegetation red-edge bands (705 nm, 740 nm, 783 nm, 865 nm) optimized for chlorophyll content estimation. The 20-meter SWIR bands (Band 11: 1.57–1.65 µm; Band 12: 2.10–2.28 µm) align with Landsat for cross-comparison. The Level-2A surface reflectance product provides atmospheric correction, reducing preprocessing needs for deforestation analysis.
MODIS (Terra/Aqua)
MODIS sensors aboard Terra and Aqua satellites deliver daily global coverage at coarser resolutions (250–1000 m), making them ideal for large-scale deforestation trend analysis. The 36 spectral bands include two vegetation indices (NDVI and EVI) precomputed at 250 m. MODIS fire products (MOD14/MYD14) detect active fires at 1 km resolution, useful for identifying slash-and-burn deforestation. The high temporal resolution enables near-real-time monitoring but lacks the spatial detail required for small-scale illegal logging detection.
Comparative Specifications
| Platform | Spatial Resolution | Temporal Resolution | Key Bands for Deforestation |
|---|---|---|---|
| Landsat 9 | 30 m (15 m pan) | 16 days | SWIR (2.11–2.29 µm), TIR (10.6–11.2 µm) |
| Sentinel-2 | 10–60 m | 5 days (dual-sat) | Red-edge (705–865 nm), SWIR (2.10–2.28 µm) |
| MODIS | 250–1000 m | 1–2 days | Fire channels (3.9–4.0 µm), NDVI/EVI |
Data fusion techniques, such as STARFM (Spatial and Temporal Adaptive Reflectance Fusion Model), combine Landsat's spatial detail with MODIS' temporal frequency to overcome individual platform limitations. Cross-sensor calibration ensures consistency when using multi-platform time series for deforestation alerts.

2.2 Data Acquisition and Access Methods
Satellite Imagery Sources
High-resolution satellite imagery is critical for deforestation detection. Key sources include:
- Landsat (NASA/USGS): Provides multispectral imagery at 30m resolution with a 16-day revisit cycle. Landsat 8 and 9 are commonly used due to their open data policy.
- Sentinel-2 (ESA Copernicus): Offers 10–60m resolution with a 5-day revisit cycle. Its 13 spectral bands, including red-edge and SWIR, enhance vegetation analysis.
- PlanetScope (Planet Labs): Delivers daily 3–5m resolution imagery, enabling near-real-time monitoring of deforestation events.
Data Access Protocols
Accessing satellite data programmatically requires APIs or cloud platforms:
- Google Earth Engine (GEE): A cloud-based platform for processing petabytes of satellite data. GEE’s Python/JavaScript APIs allow filtering by date, region, and cloud cover.
- ESA’s Copernicus Open Access Hub: Provides Sentinel-2 data via direct download or API. SciHub’s Python library (
sentinelsat) automates queries. - USGS EarthExplorer: Requires manual selection but supports bulk downloads via scripts using
landsatxplore.
Preprocessing Requirements
Raw satellite data often requires preprocessing:
where \(L_\lambda\) is spectral radiance, \(d\) is Earth-Sun distance, \(ESUN_\lambda\) is solar irradiance, and \(\theta_s\) is solar zenith angle. Cloud masking (e.g., using QA bands in Landsat or Sentinel-2’s Scene Classification Layer) is essential to exclude noise.
Cloud-Based Data Stacks
Cloud platforms like AWS Open Data Registry host analysis-ready datasets (ARD):
- Landsat ARD: Surface reflectance products with radiometric/geometric corrections applied.
- Sentinel-2 L2A: Bottom-of-atmosphere reflectance, preprocessed with Sen2Cor.
API-Based Automation
Python scripts can automate data fetching. Example using GEE’s Python API:
import ee
ee.Initialize()
geometry = ee.Geometry.Rectangle([-62.0, -10.0, -50.0, -2.0])  # Amazon region
collection = ee.ImageCollection('LANDSAT/LC08/C02/T1_L2') \
    .filterDate('2020-01-01', '2023-12-31') \
    .filterBounds(geometry) \
    .select(['SR_B4', 'SR_B5'])  # Red and NIR bands
2.3 Preprocessing Steps: Radiometric Correction and Cloud Masking
Radiometric Correction
Satellite imagery requires radiometric correction to convert raw digital numbers (DNs) to physically meaningful reflectance values. The process involves two primary transformations: sensor calibration and atmospheric correction. Sensor calibration converts DNs to at-sensor radiance Lλ using:
where gain and offset are sensor-specific calibration parameters typically provided in metadata. Atmospheric correction then transforms radiance to surface reflectance ρλ using radiative transfer models like 6S or MODTRAN:
Here, Lpath represents path radiance, Esun,λ is exoatmospheric solar irradiance, θs is solar zenith angle, and Tatm,λ is atmospheric transmittance. Advanced implementations may incorporate adjacency effects through point spread function modeling.
Cloud Masking Techniques
Cloud masking employs spectral and temporal characteristics to discriminate clouds from land surfaces. The most effective approaches combine:
- Threshold-based methods using reflectance in visible (VIS) and thermal infrared (TIR) bands. Clouds typically exhibit high VIS reflectance (>0.3) and low TIR brightness temperatures (<265K).
- Machine learning classifiers trained on spectral indices like:
Random forests and U-Nets achieve >90% accuracy when trained on manually labeled cloud masks. Temporal filtering improves results by exploiting cloud mobility - consecutive scenes should show stationary land features but moving clouds.
Operational Implementation
The Sentinel-2 cloud mask workflow demonstrates practical implementation:
- Calculate top-of-atmosphere reflectance for all bands
- Compute spectral indices (NDSI, NDVI)
- Apply threshold rules per band (B1 < 0.1, B10 > 300K)
- Run morphological operations to remove noise
- Apply temporal consistency checks for multi-date analysis
Advanced systems like Fmask 4.0 incorporate shadow detection by projecting cloud heights using digital elevation models and sun geometry. The algorithm estimates cloud height from TIR brightness temperature and calculates shadow displacement vectors:
where hcloud is cloud height and ŝazimuth is the sun azimuth unit vector.

3. Supervised Learning: Random Forests and CNNs
3.1 Supervised Learning: Random Forests and CNNs
Random Forests for Pixel-Level Classification
Random Forests (RF) operate by constructing an ensemble of decision trees during training, where each tree votes on the final classification. For deforestation detection, each pixel in a satellite image is classified based on spectral bands (e.g., RGB, NIR) and derived indices like NDVI. The decision function for a single tree is:
where Tk is the k-th tree's prediction and K is the total number of trees. The Gini impurity, used for node splitting, is calculated as:
with C classes and pi as the proportion of class i at the node. RFs handle high-dimensional data efficiently but require feature engineering for spatial context.
Convolutional Neural Networks for Spatial Feature Extraction
CNNs automatically learn hierarchical spatial-spectral features through convolutional layers. A typical architecture for deforestation detection includes:
- Convolutional blocks: 3×3 kernels with ReLU activation, extracting edges/textures
- Max-pooling: 2×2 windows reducing spatial dimensions
- Skip connections: Preserving fine-grained details for precise segmentation
The loss function combines cross-entropy and Dice coefficient for imbalanced classes:
Comparative Performance Analysis
On Landsat-8 data (30m resolution), RFs achieve ~85% accuracy with handcrafted NDVI/SAVI features, while CNNs reach ~92% using raw multi-spectral inputs. However, CNNs require 10× more training data and GPU resources. Hybrid approaches (RF for initial screening, CNN for refinement) show promise in operational deployments.
3.2 Unsupervised Learning: Clustering and Anomaly Detection
Unsupervised learning techniques are particularly valuable in deforestation detection when labeled training data is scarce or unavailable. These methods identify patterns and anomalies in satellite imagery without relying on pre-classified examples, making them adaptable to diverse geographical regions and forest types.
Clustering Approaches for Forest Cover Segmentation
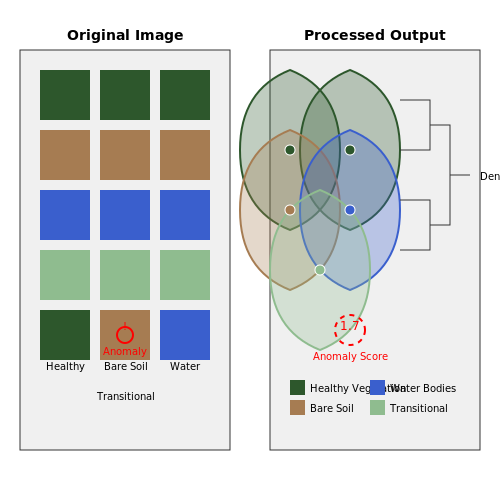
K-means clustering partitions pixels into k distinct groups based on spectral similarity. For multispectral satellite data with n bands, each pixel is represented as a vector x ∈ ℝn. The algorithm minimizes the within-cluster sum of squares:
where Ci represents cluster i and μi is its centroid. For deforestation monitoring, typical clusters might represent healthy vegetation, bare soil, water bodies, and transitional zones.
Hierarchical clustering builds a dendrogram of nested clusters, particularly useful for multi-scale analysis. The Ward linkage method minimizes variance when merging clusters:
Anomaly Detection for Deforestation Hotspots
Isolation Forest detects deforestation as anomalous regions by recursively partitioning the feature space. The anomaly score s for a pixel x is derived from the path length h in a binary tree:
where c(n) is the average path length of unsuccessful searches in a binary search tree with n instances. Deforested areas typically yield higher scores due to their spectral dissimilarity from intact forest.
One-class SVM models the distribution of healthy forest pixels using a kernel function Φ and identifies deforestation as outliers outside the decision boundary:
where αi are Lagrange multipliers and ρ is the offset from the origin in feature space.
Feature Engineering for Spectral-Temporal Analysis
Effective unsupervised deforestation detection requires carefully constructed features:
- Vegetation Indices: NDVI (Normalized Difference Vegetation Index) highlights photosynthetic activity:
$$ \text{NDVI} = \frac{\text{NIR} - \text{Red}}{\text{NIR} + \text{Red}} $$
- Temporal Differencing: ΔNDVI = NDVIt - NDVIt-1 captures abrupt changes
- Texture Metrics: Gray-level co-occurrence matrix (GLCM) features quantify spatial patterns
Principal Component Analysis (PCA) reduces dimensionality while preserving variance. The projection matrix W consists of eigenvectors of the covariance matrix Σ:
Implementation Considerations
Large-scale processing requires:
- Parallelized implementations (e.g., Spark MLlib for clustering)
- Tile-based processing to handle gigapixel imagery
- Incremental learning for streaming satellite data
Evaluation metrics for unsupervised methods include:
- Silhouette coefficient for cluster cohesion/separation
- Davies-Bouldin index for cluster quality
- Precision-recall curves for anomaly detection (when partial labels exist)
3.3 Deep Learning Architectures for Temporal Analysis
Time-series analysis of satellite imagery for deforestation detection requires architectures capable of capturing both spatial and temporal dependencies. Traditional convolutional neural networks (CNNs) excel at spatial feature extraction but struggle with temporal dynamics. Recurrent neural networks (RNNs) and their variants, such as long short-term memory (LSTM) networks, address this by modeling sequential data, but their computational inefficiency and vanishing gradient problems limit their effectiveness for long sequences.
3.3.1 Convolutional LSTM (ConvLSTM)
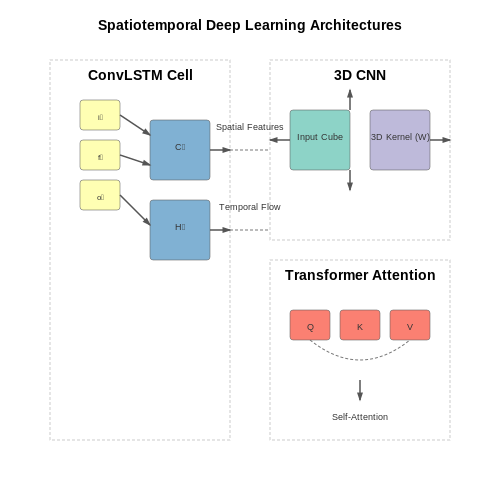
The ConvLSTM architecture replaces the fully connected layers in traditional LSTMs with convolutional operations, enabling spatiotemporal feature learning. The key equations governing a ConvLSTM cell are:
Here, it, ft, and ot represent the input, forget, and output gates, respectively. Ct is the cell state, Ht is the hidden state, and Xt is the input at time t. The operator ∗ denotes convolution, while ∘ represents the Hadamard product.
3.3.2 3D Convolutional Networks
3D CNNs extend traditional 2D convolutions by adding a temporal dimension, allowing direct learning of spatiotemporal features. The output feature map V at position (x, y, z) in layer l is computed as:
where kt, kh, and kw are the temporal, height, and width dimensions of the 3D kernel Wl, and bl is the bias term. This approach is particularly effective when the temporal resolution is high and the changes between consecutive frames are subtle.
3.3.3 Transformer-Based Approaches
Vision transformers (ViTs) adapted for temporal analysis use self-attention mechanisms to model long-range dependencies across time. The multi-head self-attention (MHSA) operation for a sequence of patches P = [p1, ..., pn] is defined as:
where Q, K, and V are learned query, key, and value matrices, and dk is the dimension of the key vectors. For temporal modeling, positional encodings are extended to include time indices, enabling the network to distinguish between spatial and temporal dimensions.
3.3.3.1 Temporal Fusion Transformers
Temporal fusion transformers (TFTs) enhance standard transformers by incorporating specialized components for temporal modeling:
- Variable selection networks dynamically weight input features based on their relevance.
- Static covariate encoders integrate time-invariant metadata (e.g., geographic location).
- Temporal self-attention layers with modified positional encodings capture seasonality and trends.
These architectures have demonstrated superior performance in deforestation detection tasks, particularly when dealing with irregularly sampled or noisy satellite data.
3.3.4 Hybrid Architectures
Recent work combines CNNs, RNNs, and transformers into unified frameworks. One effective approach uses:
- A 2D CNN backbone for spatial feature extraction from individual frames.
- A transformer encoder to model temporal relationships between frame embeddings.
- A task-specific head (e.g., fully connected layers) for final prediction.
The hybrid architecture leverages the strengths of each component while mitigating their individual limitations. For example, the CNN reduces computational complexity compared to 3D convolutions, while the transformer captures long-term dependencies more effectively than RNNs.
4. Spectral Indices (NDVI, EVI, NBR) for Vegetation Health
Spectral Indices (NDVI, EVI, NBR) for Vegetation Health
Normalized Difference Vegetation Index (NDVI)
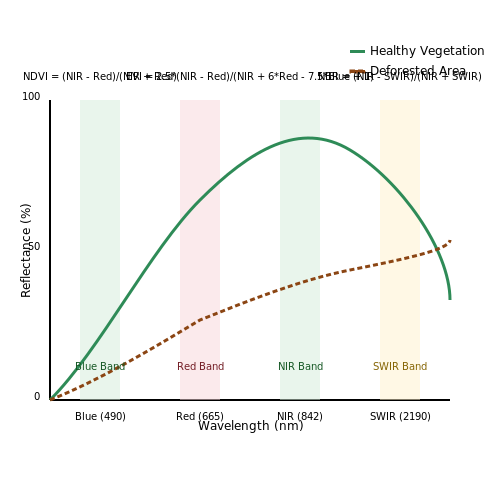
The NDVI is a widely used spectral index for assessing vegetation health by leveraging the contrast between near-infrared (NIR) and red reflectance. Healthy vegetation strongly reflects NIR while absorbing red light due to chlorophyll activity. The NDVI is computed as:
Values range from -1 to 1, where values >0.6 typically indicate dense vegetation, while values <0.1 correspond to barren land or urban areas. NDVI is sensitive to chlorophyll content but can saturate in high-biomass regions and is affected by atmospheric conditions.
Enhanced Vegetation Index (EVI)
EVI improves upon NDVI by reducing atmospheric and soil background influences through the inclusion of a blue band and canopy background adjustment factors. The formula is:
Where G is a gain factor (typically 2.5), L is the canopy background adjustment (usually 1), and C1, C2 are aerosol resistance coefficients (6.0 and 7.5 respectively). EVI provides better sensitivity in high-biomass regions and minimizes soil and atmospheric noise.
Normalized Burn Ratio (NBR)
NBR is specifically designed for assessing fire severity and post-fire recovery by utilizing NIR and shortwave infrared (SWIR) bands. The index highlights changes in vegetation moisture content:
Pre-fire and post-fire NBR differences (dNBR) quantify burn severity, with values <-0.1 indicating high-severity burns. NBR is particularly useful for monitoring deforestation caused by wildfires.
Comparative Analysis and Applications
Each index has distinct strengths:
- NDVI excels in general vegetation monitoring but saturates in dense canopies.
- EVI performs better in high-biomass areas and reduces atmospheric artifacts.
- NBR is specialized for fire impact assessment and moisture-related changes.
For deforestation detection, combining these indices improves robustness. NDVI and EVI track gradual vegetation loss, while NBR identifies abrupt changes from fires. Temporal analysis of these indices enhances detection accuracy by filtering seasonal variations.
Computational Implementation
Calculating these indices from satellite data (e.g., Landsat, Sentinel-2) involves band arithmetic. For Sentinel-2, the bands are:
- Red: Band 4 (665 nm)
- NIR: Band 8 (842 nm)
- SWIR: Band 12 (2190 nm)
- Blue: Band 2 (490 nm)
import numpy as np

def calculate_ndvi(red_band, nir_band):
    return (nir_band - red_band) / (nir_band + red_band + 1e-10)

def calculate_evi(blue_band, red_band, nir_band, L=1, C1=6, C2=7.5, G=2.5):
    return G * (nir_band - red_band) / (nir_band + C1 * red_band - C2 * blue_band + L)

def calculate_nbr(nir_band, swir_band):
    return (nir_band - swir_band) / (nir_band + swir_band + 1e-10)
4.2 Temporal Features for Change Detection
Time-Series Analysis of Spectral Indices
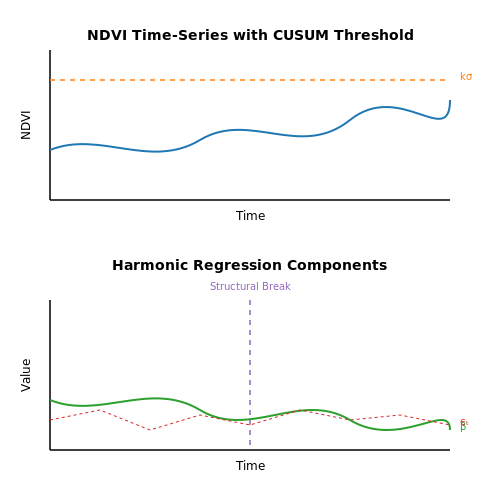
Multitemporal analysis relies on constructing dense time-series of spectral indices like NDVI (Normalized Difference Vegetation Index), EVI (Enhanced Vegetation Index), and NBR (Normalized Burn Ratio). For a given pixel at coordinates (x,y) over n time steps, the temporal signature is represented as:
where It is the spectral index value at time t. Deforestation manifests as abrupt negative deviations in this time-series. The CUSUM (Cumulative Sum) change detection algorithm calculates:
where μ and σ are the historical mean and standard deviation, and k controls sensitivity. A threshold exceedance in Ct flags potential deforestation.
Harmonic Analysis of Annual Cycles
Vegetation exhibits seasonal periodicity that can be modeled using harmonic regression:
where T is the annual cycle period (typically 365 days) and K is the number of harmonics. Deforestation causes significant residuals (ϵt) when comparing predicted and observed values. The Breaks For Additive Season and Trend (BFAST) method decomposes the time-series into:
where Tt is the trend component, St the seasonal component, and et the residuals. Structural breaks in Tt indicate land cover changes.
Cross-Sensor Temporal Alignment
When combining data from multiple satellites (e.g., Landsat, Sentinel-2), temporal features must be normalized to account for:
- Different overpass times causing illumination variations
- Spectral band differences requiring bandpass adjustment
- Varying spatial resolutions necessitating resampling
The multitemporal dataset D with m sensors is represented as:
where each Sj is normalized to a reference sensor using linear regression coefficients derived from pseudo-invariant features.
Deep Learning Approaches
Convolutional LSTMs and Transformer architectures have shown superior performance by learning spatiotemporal patterns directly from image sequences. The attention mechanism in Transformers computes:
where Q, K, and V are learned query, key, and value matrices from the input sequence, enabling the model to focus on relevant temporal contexts for change detection.
4.3 Handling Class Imbalance and Model Validation
Class imbalance is a pervasive challenge in deforestation detection, where non-deforested pixels vastly outnumber deforested ones. Traditional accuracy metrics fail under such conditions, as a model predicting the majority class exclusively can achieve misleadingly high scores. Instead, precision-recall curves and the Fβ-score provide more reliable performance measures. The Fβ-score is defined as:
where β controls the trade-off between precision and recall. For deforestation detection, β > 1 prioritizes recall to minimize false negatives, as missing deforestation events has greater ecological consequences than false alarms.
Sampling Strategies for Imbalanced Data
Three principal approaches mitigate class imbalance during training:
- Random undersampling discards majority-class samples, risking loss of informative data. The optimal retention ratio r is found via grid search:
where KL denotes the Kullback-Leibler divergence between original and sampled distributions.
- Synthetic oversampling generates minority-class samples using SMOTE (Synthetic Minority Over-sampling Technique), which interpolates feature-space neighbors. For satellite imagery, this operates on pixel embeddings from a pretrained CNN.
- Class-weighted loss functions scale cross-entropy terms inversely proportional to class frequencies. The weight wi for class i is:
where N is total samples, ni is class count, and k is the number of classes.
Spatial Cross-Validation
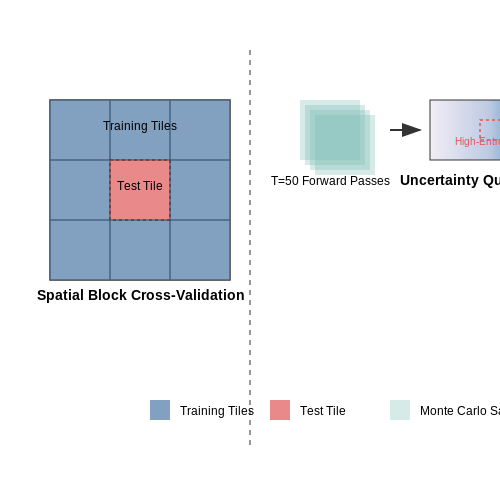
Standard k-fold validation fails for geospatial data due to spatial autocorrelation. Spatial block cross-validation partitions the study area into n × n tiles (typically n=5), ensuring training and test sets are spatially disjoint. The metric of choice is the spatially-aware Fβ score:
where TP, FN, FP are computed per tile and aggregated.
Uncertainty Quantification
Monte Carlo dropout provides pixel-wise uncertainty estimates by performing T stochastic forward passes (typically T=50) and computing the entropy across predictions:
High-entropy pixels indicate regions requiring human verification or additional sensor data.
5. Amazon Rainforest Monitoring with Sentinel-2 Data
5.1 Amazon Rainforest Monitoring with Sentinel-2 Data
Sentinel-2 multispectral imagery provides a high-resolution (10–60 m) dataset for deforestation monitoring in the Amazon rainforest. The satellite’s 13 spectral bands, including visible, near-infrared (NIR), and shortwave infrared (SWIR), enable robust vegetation analysis through spectral indices such as the Normalized Difference Vegetation Index (NDVI) and Enhanced Vegetation Index (EVI).
Spectral Indices for Deforestation Detection
NDVI exploits the contrast between red and NIR reflectance, where healthy vegetation exhibits high NIR reflectance due to chlorophyll absorption in the red band:
EVI reduces atmospheric and soil background effects by incorporating the blue band and a canopy background adjustment factor (L = 1, C1 = 6, C2 = 7.5):
Time-Series Analysis with Sentinel-2
Detecting deforestation requires temporal consistency checks to distinguish permanent forest loss from seasonal variations. A harmonic regression model decomposes the time-series signal into trend, seasonality, and residuals:
where α and β represent the intercept and linear trend, γk and δk are harmonic coefficients, and T is the period (typically 12 months).
Machine Learning Approaches
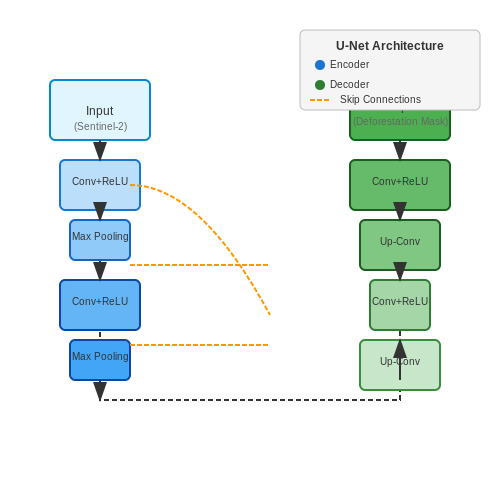
Random Forest and U-Net architectures are commonly applied to Sentinel-2 data for pixel-wise classification. A U-Net’s encoder-decoder structure with skip connections preserves spatial resolution:
The model minimizes a combined loss function incorporating cross-entropy and Dice coefficient to handle class imbalance:
Operational Challenges
Cloud cover in tropical regions necessitates preprocessing with the Sentinel-2 Cloud Mask (SCL) band or external datasets like the Cloud Score+ algorithm. Temporal compositing techniques (e.g., median-pixel composites over 30-day windows) mitigate data gaps.
5.2 Real-Time Deforestation Alerts Using MODIS
The Moderate Resolution Imaging Spectroradiometer (MODIS) aboard NASA's Terra and Aqua satellites provides near-daily global coverage at spatial resolutions of 250m to 1km, making it ideal for large-scale deforestation monitoring. The key advantage for real-time alerts lies in MODIS' high temporal resolution combined with its spectral bands sensitive to vegetation health and land cover changes.
Vegetation Index Thresholding for Change Detection
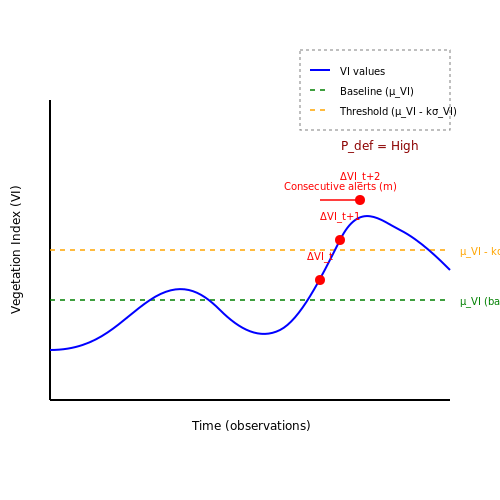
The Normalized Difference Vegetation Index (NDVI) and Enhanced Vegetation Index (EVI) serve as primary indicators for deforestation detection. A significant drop in these indices over consecutive observations signals potential forest loss. The anomaly detection can be formalized as:
where VIt is the vegetation index at time t, and n defines the baseline period (typically 8-16 days to account for seasonal variations). A deforestation alert triggers when:
where μVI and σVI are the historical mean and standard deviation of VI for the location, and k is a sensitivity parameter (typically 2-3).
Multi-Temporal Analysis for False Positive Reduction
Single observations often produce false positives due to clouds, shadows, or atmospheric effects. A more robust approach uses:
- Consecutive anomaly persistence (e.g., 3 out of 5 observations)
- Spatial consistency checks (minimum affected pixel clusters)
- Ancillary data fusion (fire detections, weather patterns)
The probability of true deforestation Pdef given m consecutive alerts can be modeled as:
where pi is the per-alert confidence derived from sensor zenith angle, cloud cover, and spectral consistency metrics.
Operational Implementation Challenges
Real-world deployment must address several technical constraints:
- Data latency: MODIS direct broadcast provides data within 3-4 hours, while standard processing takes 12-48 hours
- Cloud cover: Persistent cloud cover in tropical regions may delay detection by weeks
- Edge effects: Mixed pixels at forest boundaries require sub-pixel analysis
The spatial accuracy improves when combining multiple overpasses through super-resolution techniques. For a pixel at coordinates (x,y), the fused estimate becomes:
where weights wi incorporate view angle geometry and atmospheric conditions.
Case Study: Amazon Deforestation Monitoring
Brazil's DETER system processes MODIS data daily to generate alerts with 250m resolution. Validation against Landsat shows:
| Metric | Performance |
|---|---|
| Detection Rate | 89% for clear-sky conditions |
| False Alarm Rate | 12% (reduced to 5% with multi-temporal filtering) |
| Median Detection Lag | 9 days (cloud-free areas) |
The system's effectiveness stems from adaptive thresholding that accounts for regional vegetation characteristics and seasonal patterns. For example, cerrado savannas use different parameters than dense rainforests.
5.3 Challenges in Tropical vs. Boreal Forest Detection
1. Spectral and Temporal Characteristics
Tropical forests exhibit high spectral diversity due to dense, multi-layered canopies with heterogeneous species composition. The normalized difference vegetation index (NDVI) often saturates in these regions, limiting discrimination between intact and degraded forests. In contrast, boreal forests display lower spectral variation but stronger seasonal dynamics, with snow cover and deciduous leaf-off periods complicating time-series analysis. The modified soil-adjusted vegetation index (MSAVI) can partially mitigate soil reflectance interference in boreal zones:
2. Cloud Cover and Atmospheric Conditions
Tropical regions experience persistent cloud cover (>70% annual obscuration in Amazonia), requiring synthetic aperture radar (SAR) or cloud-penetrating LiDAR for reliable monitoring. Boreal zones face challenges from low solar angles and prolonged snow cover, which alter backscatter coefficients in C-band SAR data. Cross-polarization (HV) SAR channels show better performance for boreal deforestation detection:
3. Spatial Scale and Fragmentation Patterns
Tropical deforestation typically occurs in large, contiguous blocks (industrial agriculture) or fine-scale mosaics (smallholder farming), requiring different detection approaches. Boreal forest disturbances are often linear (pipeline corridors) or patchy (insect outbreaks), with slower regeneration rates. Multiscale segmentation algorithms must adapt to these patterns:
- Tropical: Object-based detection with 10-30m resolution
- Boreal: Pixel-based change detection at 5-10m resolution
4. Phenological Variability
Tropical forests show asynchronous phenology across species, making anomaly detection challenging. Boreal forests have predictable seasonal cycles but face "greening/browning" trends from climate change. Hidden Markov models (HMMs) can disentangle these signals:
5. Data Fusion Requirements
Effective monitoring requires fusion of optical (Landsat/Sentinel-2), SAR (Sentinel-1), and ancillary data. Tropical systems benefit from P-band SAR for biomass estimation, while boreal systems require SWIR bands for snow/vegetation discrimination. The optimal feature space varies by biome:
| Biome | Critical Bands | Temporal Resolution |
|---|---|---|
| Tropical | NIR, SWIR-2, P-band HV | ≤16 days |
| Boreal | Red Edge, C-band VV/VH | ≤5 days (winter) |
6. Validation Challenges
Ground truth collection differs substantially: tropical validation requires UAV overflights due to accessibility issues, while boreal validation uses snowmobile transects during frozen periods. The kappa coefficient (κ) must account for these sampling biases:
where po is observed agreement and pe is expected chance agreement.

6. Data Privacy and Indigenous Land Rights
6.1 Data Privacy and Indigenous Land Rights
The intersection of deforestation detection and indigenous land rights introduces critical ethical and technical challenges. Satellite imagery, while invaluable for monitoring forest cover changes, often captures data over territories governed by indigenous communities without explicit consent. High-resolution sensors, such as those on Sentinel-2 or Landsat satellites, can discern features at sub-meter scales, raising concerns about the inadvertent exposure of culturally sensitive or proprietary information. For instance, spectral indices like the Normalized Difference Vegetation Index (NDVI) may reveal sacred groves or subsistence farming patterns, which could be exploited if data is misused.
Legal and Ethical Frameworks
International instruments such as the United Nations Declaration on the Rights of Indigenous Peoples (UNDRIP) emphasize free, prior, and informed consent (FPIC) for data collection affecting indigenous lands. Technically, this necessitates geofencing algorithms to exclude or anonymize data from protected regions. Differential privacy techniques, such as adding Laplace noise to coordinates, can be mathematically formulated as:
where Δf is the sensitivity of the query f and ϵ controls the privacy-utility trade-off. Implementing this requires careful calibration to avoid degrading deforestation detection accuracy, particularly when monitoring small-scale illegal logging.
Case Study: Amazon Basin Monitoring
In the Brazilian Amazon, the Instituto Socioambiental (ISA) employs participatory mapping, integrating satellite data with indigenous knowledge. This hybrid approach ensures that deforestation alerts generated by convolutional neural networks (CNNs) are validated by local communities before triggering legal actions. However, challenges persist in reconciling real-time monitoring needs with data sovereignty. For example, edge-computing solutions that preprocess imagery on local servers, rather than cloud platforms, can reduce reliance on external data pipelines.
Technical Mitigations
- Federated Learning: Train deforestation models on decentralized data without raw image transfer, using secure aggregation protocols.
- Homomorphic Encryption: Perform computations on encrypted pixel values, though computational overhead remains prohibitive for large-scale analysis.
- Metadata Scrubbing: Strip EXIF tags and other metadata from satellite images to prevent reverse geolocation of indigenous settlements.
These measures must be complemented by policy frameworks that define data ownership and usage rights. For instance, the Global Forest Watch platform now allows indigenous groups to opt out of public deforestation alerts, though algorithmic transparency remains limited.
6.2 Bias in Training Data and Algorithmic Fairness
Training data bias in deforestation detection models can manifest in multiple ways, often leading to systematic errors that disproportionately affect certain regions or forest types. One common source of bias is geographical imbalance, where datasets overrepresent certain biomes (e.g., tropical rainforests) while underrepresenting others (e.g., boreal forests). This skews model performance, as seen in a 2021 study where a model trained on Amazonian data achieved 92% precision in South America but only 63% in Southeast Asia due to spectral signature differences.
Mathematical Formulation of Sampling Bias
Let X be the feature space of satellite imagery and Y the deforestation labels. The true data distribution P(X,Y) is often approximated by an empirical distribution Q(X,Y) from available training data. Sampling bias occurs when:
where KL is the Kullback-Leibler divergence and ε is an acceptable threshold. For multispectral data, this divergence often appears in band-specific distributions:
where μ and σ are the mean and standard deviation of near-infrared reflectance values.
Algorithmic Fairness Metrics for Spatial Analysis
Traditional fairness metrics require adaptation for geospatial contexts. The equality of opportunity criterion becomes:
for each geographical group g. Acceptable fairness requires:
Case studies show that models trained on Global Forest Watch data exhibit TPR disparities exceeding 0.25 between equatorial and temperate regions when using standard ResNet architectures.
Mitigation Strategies
- Stratified sampling by biome type and cloud cover frequency
- Domain adaptation using CycleGAN for cross-region feature alignment
- Loss reweighting with inverse class frequency per ecoregion
A 2022 benchmark showed that combining these methods reduced fairness gaps by 38% on the Sentinel-2 Multi-Biome Deforestation dataset while maintaining overall accuracy.
Temporal Bias in Deforestation Time Series
Seasonal variations introduce time-dependent bias. The temporal consistency error for a model f at time t is:
where Δ t is the seasonal period. Models without proper temporal augmentation show TCE values 2-3× higher during dry vs. wet seasons in tropical datasets.
6.3 Integrating Detection Systems with Conservation Policies
Automated deforestation detection systems achieve their full impact only when tightly coupled with conservation policy frameworks. The integration requires addressing technical, legal, and operational challenges to ensure real-time alerts translate into actionable interventions. A critical first step involves aligning the spatial and temporal resolution of satellite-based detections with jurisdictional boundaries and reporting cycles of environmental agencies. For instance, Brazil's PRODES system demonstrates this by delivering annual deforestation reports synchronized with the Amazon biome's administrative divisions.
Policy-Driven Model Optimization
Detection models must adapt to region-specific deforestation drivers and legal thresholds. In Indonesia, where smallholder agriculture dominates, algorithms prioritize detecting sub-hectare clearings with high precision to distinguish illegal encroachment from permitted activities. The model's output confidence scores Pdetect require calibration against legal evidentiary standards:
where S represents the detected deforestation signature strength and k controls the steepness of the probability curve around the jurisdiction's evidentiary threshold Sthreshold.
Operational Integration Pathways
Three primary integration architectures have emerged in successful deployments:
- API-based alert streaming to mobile enforcement units, as implemented by Global Forest Watch's Forest Watcher app, reducing response latency to under 48 hours
- Blockchain-verified evidence chains for court-admissible documentation, pioneered by the Earth Observation for Sustainable Development initiative
- Automated compliance scoring systems that link detected deforestation to specific land parcels in cadastral databases
Case Study: Ecuador's Early Warning System
The MAATE ministry's implementation combines Sentinel-2 L2A data with a modified U-Net architecture achieving 92% recall for >0.5ha clearings. Detections trigger a multi-stage verification pipeline:
- Automated cloud/shadow masking using a pre-trained ResNet-18
- Change detection via NDVI differencing with adaptive thresholds
- Cross-validation against land use permits using geospatial joins
This system reduced illegal deforestation incident resolution time from 83 to 19 days between 2020-2023.
Legal and Ethical Constraints
Detection systems operating across jurisdictions must account for varying data privacy regimes. The European Union's GDPR imposes strict limitations on high-resolution monitoring, requiring:
where Rsensor is the sensor's native resolution and Rlegal the minimum allowed pixel size under local privacy laws. In Germany, this has led to the development of purpose-built 10m resolution models despite available commercial sub-meter data.
7. Key Research Papers and Benchmark Datasets
7.1 Key Research Papers and Benchmark Datasets
- Deforestation Detection with Deep Learning from Multispectral and ... — Feature papers represent the most advanced research with significant potential for high impact in the field. ... Applications of multispectral and hyperspectral satellite images for deforestation detection; ... Our approach was also evaluated against two forest disturbance benchmark datasets derived from LandTrendr and the Global Forest Change ...
- Deep Learning for Satellite Image Segmentation: Deforestation Detection ... — This study aims to develop and apply deep learning techniques for effective deforestation detection and reforestation zone identification using satellite imagery. 3 Literature Review The imperative to monitor and manage land use and land cover (LULC) changes has never been more critical amidst the accelerating deforestation rates worldwide.
- PDF Deforestation Detection in The Amazon With Sentinel-1 Sar Image ... - Isprs — most relevant research related to ours below. Deforestation detection with traditional machine learning Two of the most prominent and widely used approaches in prac-tice for deforestation detection at a very large scale using se-quences of satellite images are GLobal Analysis and Discovery (GLAD) (Hansen et al., 2016) and RAdar for Detecting De-
- Satellite Imagery for Deforestation Prediction using Deep Learning — Deforestation has become a very big concern today. It affects the climate in an inconsiderable amount. We use advanced machine learning algorithms to detect deforestation in vulnerable places. The deforestation in these places will be detected and interpreted using advanced techniques. We use algorithms like detection and segmentation for identifying the lands which are deforested. If the ...
- A Satellite Band Selection Framework for Amazon Forest Deforestation ... — using the DeepLabv3+model. Both works utilize Landsat-8 satellite images with all seven spectral bands in addition to Normalized Dif-ference Vegetation Index (NDVI). In Maretto et al. [27], an approach for deforestation detection via semantic segmentation of Landsat-8 images with image fusion based on the well-known U-Net architec-ture was ...
- Frontiers | Deforestation detection using deep learning-based semantic ... — By training deep learning models on large datasets of satellite imagery, these methods can accurately and efficiently identify the deforested regions at a global scale (Chen et al., 2021). This approach has the potential to accurately detect and map deforested areas, enabling better monitoring and management of forests.
- Monitoring Deforestation Using Satellite Imagery and Machine Learning — This research aims to utilize Sentinel-2 satellite imagery to effectively monitor deforestation. By By leveraging the high-resolution, multispectral capabilities of Sentinel-2, the study seeks to ...
- Using Deep Learning on Satellite Images to Identify Deforestation ... — We collected images from Kaggle dataset and the rest were acquired from Planet.org, a website which provides satellite images over a timeline. Satellite images have an accuracy up to 3 m. High resolution image was essential to capture the details of our region of interest. The details in a high resolution make feature detection possible using ...
- (PDF) Early Detection of Deforestation through Satellite Land ... — This study has developed a CNN model applied to classify the eight classes of land cover through satellite images. Early detection of deforestation has become one of the study's objectives.
- Deforestation detection using a spatio-temporal deep learning approach ... — Traditionally, deforestation has been defined as the loss of a forest, which translates into an area of at least 0.5 ha with more than 5 m in height and 10 % tree cover (FAO, 2018).Few studies using remote sensing to detect deforestation have tried to differentiate between dissimilar tree-dominated covers, such as plantations, degraded forests or old-growth forests (Fernández-Montes de Oca et ...
7.2 Open-Source Tools and Libraries
- A Satellite Band Selection Framework for Amazon Forest Deforestation ... — The pipeline of the Landsat-8 band selection framework based on UMDA for deforestation detection is depicted as follows: (a) displays an image from the Landsat-8 imaging satellite with its seven spectral bands, (b) represents the false-color image formed by three principal components of PCA (Jolliffe, 2011), (c) illustrates the output of the ...
- Monitoring Deforestation Using Satellite Imagery and Machine Learning — This project utilizes Sentinel-2 satellite imagery and the Normalized Difference Vegetation Index (NDVI) to monitor deforestation, highlighting its effectiveness in identifying and visualizing deforested areas. The methodology includes data acquisition, NDVI calculation, thresholding for classification, and visualization, demonstrating the potential of remote sensing and machine learning for ...
- Is the change deforestation? Using time-series analysis of satellite ... — Additionally, the rate of algorithm deforestation detection was evaluated in 15 randomly selected reference polygons including both, native vegetation and plantations. The reference date of deforestation was selected by visually interpreting the first Landsat image where deforestation was evident.
- Monitoring Deforestation Using Satellite Imagery and Machine Learning — The primary data source for this project is Sentinel-2 satellite imagery, which provides high- resolution multispectral images suitable for vegetation analysis. The specific dataset used in
- Artificial Intelligence Techniques for Satellite Image ... - Scribd — The document discusses the integration of artificial intelligence (AI) techniques in remote sensing and satellite image analysis, highlighting advancements in sensor technology and the need for interdisciplinary research. It outlines various applications of AI in satellite imagery, including object detection, clustering, and crop classification, while also emphasizing the importance of ...
- (PDF) FORSAT: a 3D forest monitoring system for cover mapping and ... — A 3D forest monitoring system, called FORSAT (a satellite very high resolution image processing platform for forest assessment), was developed for the extraction of 3D geometric forest information from very high resolution (VHR) satellite imagery and the automatic 3D change detection.
- Assessment of forest restoration with multitemporal remote sensing imagery — Remote sensing imagery. Formosat-2 is the first satellite with a high-spatial-resolution (2 m) sensor placed in a daily revisit orbit, as well as the second satellite that is owned and operated by ...
- A Learning Strategy for Amazon Deforestation Estimations Using Multi ... — Estimations of deforestation are crucial as increased levels of deforestation induce serious environmental problems. However, it is challenging to perform investigations over extensive areas, such as the Amazon rainforest, due to the vast size of the region and the difficulty of direct human access. Satellite imagery can be used as an effective solution to this problem; combining optical ...
- Remote Sensing and Measuring Deforestation - ScienceDirect — Download: Download full-size image Figure 2.1. An example of information collected by remote sensing: a) moderate forest degradation with cutting sites in the process of regeneration in a Landsat image in a color composite with mid-infrared (IR), near-IR and red (in the red, green and blue channels, respectively); b) intense degradation with large portions of the ground visible following ...
- (PDF) A Learning Strategy for Amazon Deforestation ... - ResearchGate — Satellite imagery can be used as an effective solution to this problem; combining optical images with synthetic aperture radar (SAR) images enables deforestation monitoring over large areas ...
7.3 Recommended Courses and Workshops
- GitHub - juncyan/landslide: Techniques for deep learning with satellite ... — Flood Event Detection Utilizing Satellite Images. 2.3.15. ETCI-2021-Competition-on-Flood-Detection-> Experiments on Flood Segmentation on Sentinel-1 SAR Imagery with Cyclical Pseudo Labeling and Noisy Student Training, with arxiv paper. 2.3.16. FDSI-> Flood Detection in Satellite Images - 2017 Multimedia Satellite Task. 2.3.17.
- Monitoring Deforestation Using Satellite Imagery and Machine Learning — Satellite imagery enables the detection and analysis of land cover changes, facilitating the identification of deforested areas. 2.2 Sentinel-2 Satellite Imagery
- A Satellite Band Selection Framework for Amazon Forest Deforestation ... — The pipeline of the Landsat-8 band selection framework based on UMDA for deforestation detection is depicted as follows: (a) displays an image from the Landsat-8 imaging satellite with its seven spectral bands, (b) represents the false-color image formed by three principal components of PCA (Jolliffe, 2011), (c) illustrates the output of the ...
- A Satellite Band Selection Framework for Amazon Forest Deforestation ... — using the DeepLabv3+model. Both works utilize Landsat-8 satellite images with all seven spectral bands in addition to Normalized Dif-ference Vegetation Index (NDVI). In Maretto et al. [27], an approach for deforestation detection via semantic segmentation of Landsat-8 images with image fusion based on the well-known U-Net architec-ture was ...
- PDF A Specific Segmentation Approach to Measure Deforestation from Satellite ... — of the method to other satellite images. Fig. 8. Yellow marker area: original image and it after segmentation by Otsu and Li thresholds. Fig. 9. Red marker area: original image and it after segmentation by Otsu and Li thresholding approaches. 5 Conclusions By analyzing the masks applied to false-color images, it is possible to realize that the
- PDF Use of the SAR Shadowing Effect for Deforestation Detection with ... — A deforestation detection method based on this approach was tested in a 600,000 ha site in Peru. A detection rate of more than 95% is obtained for samples larger than 0.4 ha, and the method was found to perform better than the optical-based UMD-GLAD Forest Alert dataset both in terms of spatial and temporal detection. Further work
- Use of the SAR Shadowing Effect for Deforestation Detection with ... - MDPI — To detect deforestation using Earth Observation (EO) data, widely used methods are based on the detection of temporal changes in the EO measurements within the deforested patches. In this paper, we introduce a new indicator of deforestation obtained from synthetic aperture radar (SAR) images, which relies on a geometric artifact that appears when deforestation happens, in the form of a shadow ...
- Change Detection for Forest Ecosystems Using Remote Sensing Images with ... — The dataset was generated using imagery obtained from Sentinel-2 satellites, specifically the ONERA Satellite Change Detection Dataset . Their methodology involved dividing each image into patches with dimensions of 96 × 96 × C. Weights for each class were calculated based on the number of pixels associated with each class, addressing the ...
- PDF Field guide for forest mapping with high resolution satellite data - Europa — Monitoring deforestation and forest degradation in the context of the UN-REDD programme The Tanzania REDD+ initiative Field guide for forest mapping with high resolution satellite data Report EUR26922 EN
- (PDF) Monthly mapping of forest harvesting using dense time series ... — Results showed: (1) the spatial optimization alone can improve the accuracies of deforestation mapping from single-date S1 images for up to 7.3%; (2) the Bayesian-based temporal optimization ...