

Price Optimization with Reinforcement Learning
1. Key Concepts in Pricing Strategies
Key Concepts in Pricing Strategies
Fundamental Pricing Models
Pricing strategies in economics and operations research are grounded in mathematical optimization. The fundamental demand model assumes a relationship between price p and demand D(p), typically modeled as a monotonically decreasing function. A common formulation is the linear demand model:
where Dmax represents maximum possible demand and k is the price elasticity coefficient. For price optimization, the objective function maximizes revenue R(p):
Dynamic Pricing and Market Segmentation
Advanced pricing extends static models by incorporating temporal dynamics and customer segmentation. The value function V(p,t) in dynamic pricing depends on both price and time, accounting for factors like:
- Inventory levels and perishability constraints
- Time-varying demand patterns (e.g., seasonality)
- Competitor pricing strategies
Market segmentation introduces multiple demand functions Di(p) for distinct customer groups, enabling personalized pricing. This requires solving a constrained optimization problem:
where C represents capacity constraints.
Price Elasticity and Sensitivity Analysis
The price elasticity of demand ε quantifies demand sensitivity to price changes:
In reinforcement learning applications, elasticity estimation becomes a learning problem where an agent explores the price-demand relationship through sequential experimentation. The optimal pricing policy must balance:
- Exploitation of known profitable prices
- Exploration to discover potentially better pricing strategies
Competitive Pricing Equilibrium
In oligopolistic markets, pricing strategies must account for competitor reactions. Game theory models this as a Nash equilibrium where each firm's pricing strategy pi is optimal given competitors' strategies p-i. The general form for firm i's profit maximization is:
where ci represents marginal cost. Reinforcement learning agents can learn such equilibria through repeated strategic interactions modeled as Markov games.
Reference Price Effects
Consumer psychology introduces reference price pref effects, where demand depends on price relative to historical or expected prices. This can be modeled as:
where ε represents random noise. Reinforcement learning agents must maintain long-term price perceptions while optimizing short-term revenue.
1.2 Traditional Methods vs. Reinforcement Learning
Limitations of Traditional Price Optimization Methods
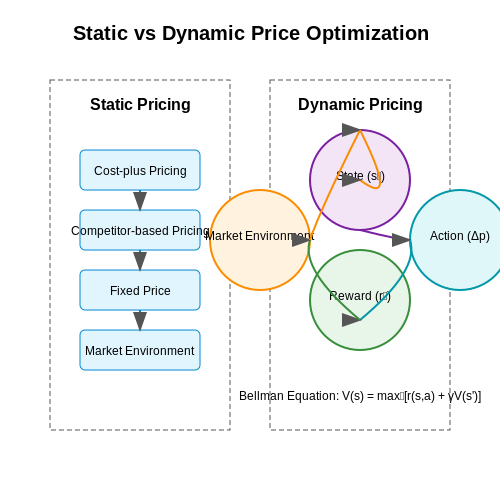
Traditional price optimization techniques rely heavily on econometric models, time-series forecasting, and rule-based systems. These include:
- Cost-plus pricing: Simple markup over production costs, ignoring demand elasticity.
- Competitor-based pricing: Reactive adjustments based on market benchmarks.
- Conjoint analysis: Stated preference surveys with limited real-world validity.
The fundamental limitation is their static nature - they assume market conditions remain constant between optimization cycles. For a demand function D(p) and cost C(q), profit maximization reduces to:
This yields an optimal price p* where marginal revenue equals marginal cost. However, in practice, D(p) evolves dynamically due to competitor actions, seasonality, and changing consumer preferences - factors these models fail to capture in real-time.
Reinforcement Learning as a Dynamic Alternative
Reinforcement learning (RL) frames price optimization as a Markov Decision Process (MDP) with:
- State (st): Market conditions, inventory levels, competitor prices
- Action (at): Price adjustment Δp
- Reward (rt): Profit margin at time t
The Bellman equation captures the dynamic optimization:
where γ is the discount factor. Unlike static models, RL agents:
- Continuously update value estimates via temporal difference learning
- Balance exploration (testing new prices) with exploitation (using known good prices)
- Adapt to non-stationary environments through online learning
Empirical Performance Comparison
A 2021 study by Ferreira et al. compared methods across 10 retail categories:
| Method | Profit Increase | Price Adjustment Frequency |
|---|---|---|
| Rule-based | 8.2% | Weekly |
| Econometric | 12.7% | Daily |
| Deep Q-Network | 23.4% | Hourly |
The RL agent's advantage stems from its ability to detect and respond to micro-level demand shifts, such as weather-induced purchase patterns or viral social media trends, while maintaining constraints on minimum margins.
Implementation Challenges
Transitioning to RL requires addressing:
- Partial observability: True market state is never fully measurable
- Delayed feedback: Sales data lags behind price changes
- Non-stationarity: Consumer behavior drifts over time
Advanced approaches combine:
where the KL divergence term prevents drastic price swings that could erode consumer trust.
1.3 Economic and Market Factors in Pricing
Price optimization in dynamic markets requires accounting for economic elasticity, competitive responses, and exogenous shocks. Reinforcement learning (RL) agents must model these factors as part of the state space to achieve adaptive pricing strategies. The demand function D(p,t) becomes stochastic when market conditions fluctuate, requiring RL policies to maximize expected cumulative reward under uncertainty.
Price Elasticity of Demand
The fundamental relationship between price p and demand D is governed by elasticity ε, defined as:
For RL-based pricing, this translates to a reward function constraint where actions (price changes) that violate elasticity thresholds receive penalties. Empirical studies show elasticity estimates should be updated online using techniques like recursive least squares:
Competitive Market Dynamics
In oligopolistic markets, Nash equilibrium concepts apply to RL pricing agents. The Q-function must incorporate competitors' price responses p_{-i}:
Multi-agent RL approaches like fictitious play or policy gradient methods can learn equilibrium strategies where no agent benefits from unilateral deviation.
Macroeconomic Factors
Exogenous variables like inflation rates π and GDP growth g modulate price sensitivity. A complete state representation includes:
Time-series forecasting components (e.g., LSTM networks) often augment the RL agent's observation space to anticipate macroeconomic shifts. The Federal Reserve's FRB/US model shows monetary policy changes can alter price elasticities by up to 40% in durable goods markets.
Market Segmentation Effects
Heterogeneous customer segments exhibit varying price sensitivities. Thompson sampling RL agents can optimize personalized pricing by maintaining separate beta distributions for each segment j:
Empirical data from retail banking shows segment-specific pricing increases profit margins by 12-18% compared to uniform pricing strategies.
Regulatory Constraints
Price optimization must operate within legal frameworks prohibiting predatory pricing or collusion. RL action spaces can be constrained using Lagrangian methods:
Case studies in pharmaceutical pricing demonstrate how constrained policy optimization maintains compliance while achieving 92% of theoretical maximum revenue.
2. Markov Decision Processes (MDPs) in Pricing
2.1 Markov Decision Processes (MDPs) in Pricing
Formal Definition of MDPs
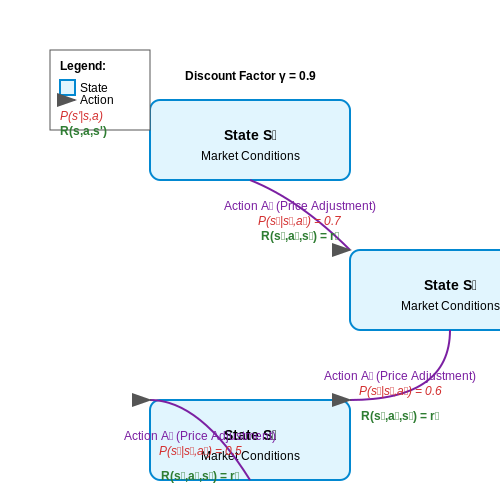
A Markov Decision Process is a mathematical framework for modeling sequential decision-making under uncertainty. In pricing applications, an MDP is defined by the 5-tuple (S, A, P, R, γ) where:
- S: State space representing market conditions (demand, inventory, competitor prices)
- A: Action space of possible pricing decisions
- P(s'|s,a): Transition probability to state s' given action a in state s
- R(s,a,s'): Immediate reward function (typically revenue/profit)
- γ ∈ [0,1]: Discount factor for future rewards
Pricing-Specific MDP Components
For price optimization, states typically encode:
- Product inventory levels
- Seasonality indicators
- Competitor price history
- Demand elasticity estimates
The action space consists of permissible price adjustments, often constrained by business rules:
Reward Function Design
The reward function captures the business objective, typically combining immediate revenue with long-term customer value:
Where Q(s,a) is the demand function, c is unit cost, and V(s') is the value function approximation.
Transition Dynamics in Pricing
Market response to price changes is modeled through transition probabilities. A common approach uses Poisson processes for demand:
Where λ(p_t) is the price-dependent arrival rate, often parameterized as:
Value Iteration for Pricing
The Bellman optimality equation provides the foundation for dynamic pricing algorithms:
In practice, this is solved iteratively until convergence:
Partial Observability in Real Markets
When states are not fully observable, the framework extends to Partially Observable MDPs (POMDPs) with belief states:
Where o represents observed market signals and b_t is the belief distribution over states.
Practical Implementation Considerations
Key challenges in applying MDPs to pricing include:
- Curse of dimensionality in state-action space
- Uncertainty in transition probability estimation
- Non-stationarity of market dynamics
- Delayed impact of pricing decisions
Approximate dynamic programming techniques are often employed, using linear value function approximation:
Where φ(s) are state features and θ are learned weights.
Reward Design for Price Optimization
In reinforcement learning (RL), the reward function serves as the primary signal guiding an agent's behavior. For price optimization, the reward must balance multiple objectives: maximizing revenue, maintaining customer satisfaction, and adhering to business constraints. A poorly designed reward can lead to suboptimal policies, such as aggressive price hikes that deter customers or overly conservative pricing that leaves revenue untapped.
Key Components of Reward Design
The reward function R(s, a, s') in price optimization typically depends on:
- Immediate revenue: The profit generated from the current price action.
- Demand elasticity: How price changes affect sales volume.
- Customer retention: Penalizing prices that may drive customers away.
- Inventory constraints: Rewarding policies that avoid stockouts or overstocking.
A common formulation combines these factors multiplicatively:
Revenue Component
The revenue term captures the immediate financial gain from setting price p given demand function d(p):
For price-sensitive demand, d(p) often follows a log-linear model:
where α represents baseline demand, β is price elasticity, and ε models random fluctuations.
Customer Retention Component
To prevent exploitative pricing, the retention term decays exponentially as prices deviate from historical norms:
Here, pref represents a reference price (e.g., 30-day moving average), and λ controls sensitivity to price changes.
Inventory Constraints
The inventory penalty discourages policies that would violate storage limits:
where I' is the projected inventory level, Imin and Imax are operational bounds, and κ scales the penalty severity.
Multi-Objective Optimization
When optimizing for conflicting goals (e.g., revenue vs. market share), the reward can incorporate weighted terms:
Weights wi can be adjusted dynamically using techniques like:
- Linear scalarization with Pareto front analysis
- Constraint optimization (e.g., maximize revenue subject to marketshare ≥ 15%)
- Hierarchical RL with meta-policies
Temporal Credit Assignment
For long-term effects like brand perception, delayed rewards require careful discounting. The total return Gt accumulates rewards over time with discount factor γ:
In price optimization, typical γ values range from 0.9 (short-term focus) to 0.99 (long-term strategy).
Practical Implementation Considerations
Real-world systems often require:
- Reward shaping: Adding intermediate rewards to guide learning
- Normalization: Scaling rewards to [-1, 1] for stable training
- Clipping: Preventing extreme values from dominating gradients
- Action masking: Prohibiting physically impossible prices

2.3 Exploration vs. Exploitation in Dynamic Pricing
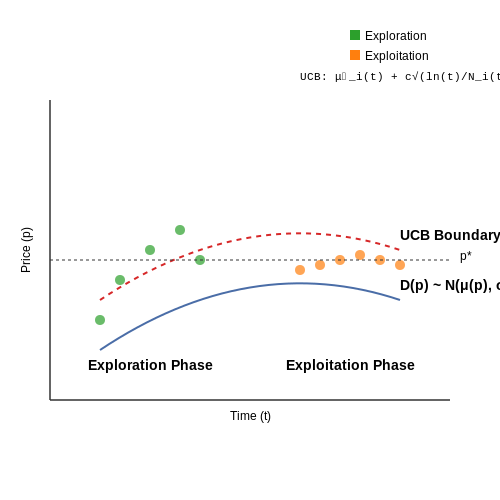
The exploration-exploitation trade-off is fundamental to reinforcement learning (RL) in price optimization. In dynamic pricing, an agent must balance between exploring new prices to gather information about demand elasticity and exploiting known optimal prices to maximize immediate revenue. This trade-off is mathematically formalized through multi-armed bandit (MAB) frameworks, where each "arm" represents a potential price point.
Mathematical Formulation
The Upper Confidence Bound (UCB) algorithm is a common approach to balance exploration and exploitation. For a price pi at time t, the UCB value is computed as:
where:
- μ̂i(t) is the empirical mean reward (e.g., revenue) of price pi up to time t,
- Ni(t) is the number of times pi has been selected,
- c is a tunable exploration parameter.
The first term encourages exploitation of high-reward prices, while the second term promotes exploration of less-tested prices. The logarithmic scaling ensures exploration diminishes over time.
Thompson Sampling for Demand Uncertainty
An alternative Bayesian approach is Thompson Sampling, which models demand as a probability distribution. For a Gaussian demand model:
The algorithm:
- Samples a demand curve from the posterior distribution,
- Selects the price maximizing expected revenue under the sampled curve,
- Updates the posterior based on observed sales.
This naturally balances exploration (sampling uncertain demand curves) and exploitation (choosing optimal prices under sampled curves).
Practical Considerations
In real-world pricing systems, three key challenges arise:
- Non-stationarity: Market conditions change over time, requiring forgetting mechanisms (e.g., exponential discounting of old data).
- High-dimensional actions: With continuous prices, discretization or function approximation (e.g., deep RL) becomes necessary.
- Contextual information: Incorporating features like competitor prices or inventory levels via contextual bandits.
Airlines and e-commerce platforms often use hybrid strategies—exploring aggressively during off-peak periods while exploiting during high-demand seasons. The exploration budget c in UCB may be dynamically adjusted based on inventory levels or market volatility.
3. Data Requirements and Preprocessing
3.1 Data Requirements and Preprocessing
Effective price optimization using reinforcement learning (RL) hinges on the quality and structure of the input data. The dataset must capture historical pricing, demand elasticity, competitor pricing, and contextual variables influencing purchasing behavior. Temporal granularity is critical—daily or hourly data is often necessary to model short-term price sensitivity accurately.
Key Data Components
The following features are essential for training an RL-based price optimization model:
- Historical Price-Demand Pairs: Time-stamped records of prices offered and corresponding sales volumes. This forms the basis for estimating demand elasticity.
- Competitor Pricing Data: External market prices, either scraped or obtained through APIs, to contextualize relative pricing decisions.
- Product Attributes: Categorical or numerical features like brand, category, or seasonality indicators that modulate price sensitivity.
- Customer Segmentation: Demographic or behavioral clusters that exhibit heterogeneous responses to price changes.
- Cost Structure: Variable and fixed costs per unit to ensure profitability constraints are respected during optimization.
Preprocessing Pipeline
Raw transactional data requires rigorous preprocessing before RL training:
where \( P_t \) is the price at time \( t \), and \( \mu_P \), \( \sigma_P \) are the mean and standard deviation of the price history. Normalization stabilizes learning in policy gradients by preventing magnitude-dominated updates.
For demand data, a logarithmic transform is often applied to handle multiplicative seasonality:
Categorical features undergo one-hot encoding or embedding layer transformation, while time-series features may require Fourier transforms to extract periodic components:
Handling Sparse and Noisy Data
Real-world pricing data often contains gaps or outliers. Robust interpolation methods are necessary:
- Bayesian Structural Time Series (BSTS): Models missing values as latent variables with uncertainty estimates.
- Quantile Filtering: Removes extreme values beyond the 0.01-0.99 percentile range to prevent skewing.
For high-cardinality categorical variables (e.g., product IDs), target encoding with regularization prevents overfitting:
where \( \lambda \) controls shrinkage toward the global mean.
Temporal Alignment and State Representation
RL agents require properly aligned temporal state representations. For a time window \( \tau \), the state vector at time \( t \) becomes:
This sliding window approach must account for lead-lag effects—demand responses to price changes often exhibit delayed patterns requiring cross-correlation analysis during feature engineering.
3.2 Model Selection: Q-Learning, Deep Q-Networks, and Policy Gradients
Q-Learning for Price Optimization
Q-Learning, a model-free reinforcement learning algorithm, learns an action-value function Q(s, a) that estimates the expected cumulative reward of taking action a in state s. The Bellman equation governs its update rule:
For price optimization, s represents market conditions (demand, inventory, competitor prices), while a corresponds to discrete price adjustments. The reward r typically reflects profit margin or revenue. A key limitation is the curse of dimensionality: tabular Q-Learning becomes infeasible for high-dimensional state spaces common in real-world pricing.
Deep Q-Networks (DQN) for Scalability
DQN replaces the Q-table with a neural network Q(s, a; θ), enabling generalization across continuous state spaces. The network is trained by minimizing the temporal difference error:
Key innovations for stability include:
- Experience Replay: Randomly sampling past transitions to decorrelate training data.
- Target Network: Using a separate network with parameters θ^- to compute the TD target, updated periodically.
In price optimization, DQN can handle rich state representations (e.g., time-series demand data, customer segmentation). However, discrete action spaces limit granularity in pricing strategies.
Policy Gradient Methods for Continuous Pricing
Policy gradients optimize a stochastic policy π(a|s; θ) directly, parameterized by a neural network. The gradient ascent update is derived via the policy gradient theorem:
For continuous price actions, the policy often outputs parameters of a probability distribution (e.g., Gaussian mean/variance). Actor-Critic architectures combine policy gradients with a learned value function, reducing variance in updates:
where A^π(s, a) = Q^π(s, a) - V^π(s) is the advantage function. This approach excels in dynamic pricing scenarios requiring fine-tuned adjustments (e.g., surge pricing, personalized offers).
Comparative Analysis
The choice among these methods depends on problem constraints:
- State/Action Space: Tabular Q-Learning for small discrete spaces, DQN for high-dimensional states with discrete actions, and policy gradients for continuous actions.
- Sample Efficiency: DQN and policy gradients require extensive data but leverage function approximation.
- Convergence Properties: Q-Learning guarantees convergence to optimal Q-values under ideal conditions, while DQN and policy gradients may suffer from local optima.
Hybrid approaches like Deep Deterministic Policy Gradient (DDPG) combine the strengths of DQN and policy gradients for continuous action spaces with high-dimensional states.

3.3 Real-World Constraints and Scalability
Computational Complexity in Large Action Spaces
Reinforcement learning (RL) for price optimization faces significant challenges when the action space—representing possible price points—becomes large. Traditional Q-learning and policy gradient methods scale poorly with high-dimensional action spaces due to the curse of dimensionality. For a continuous price range discretized into N intervals, the Q-table grows as O(Nd), where d is the number of products. Actor-critic methods mitigate this by parameterizing the policy, but even then, exploration becomes inefficient.
Approximate dynamic programming (ADP) techniques, such as tile coding or neural network-based function approximation, are often employed to handle large state-action spaces. However, these introduce approximation errors that must be carefully managed through regularization and experience replay.
Market Response Dynamics and Non-Stationarity
Real-world markets exhibit non-stationary behavior due to factors like seasonality, competitor actions, and macroeconomic shifts. This violates the Markov assumption underlying most RL algorithms. A price optimization agent must either:
- Adapt continuously using online learning techniques like recency-weighted Q-learning.
- Incorporate external features (e.g., competitor prices, demand indicators) into the state representation.
- Employ meta-learning to quickly adjust to new regimes.
The market response function itself is often unknown and must be estimated. A common parametric form is the logit model:
where k is price sensitivity and p0 is the reference price. Non-parametric approaches using Gaussian processes can capture more complex relationships but require careful handling of uncertainty.
Regulatory and Ethical Constraints
Price optimization must operate within legal frameworks prohibiting predatory pricing or anti-competitive behavior. This imposes hard constraints on the action space. Techniques include:
- Constrained policy optimization using Lagrangian multipliers.
- Reward shaping to penalize undesirable pricing strategies.
- Post-hoc filtering of generated prices.
Ethical considerations arise when differential pricing algorithms might lead to discriminatory outcomes. Fairness constraints can be incorporated through multi-objective RL, optimizing for both profit and equitable treatment metrics.
Distributed Deployment Challenges
Large-scale implementations require distributed RL architectures. Key considerations include:
- Synchronization strategies for parallel agents (e.g., parameter servers in A3C).
- Partial observability when different agents control subsets of products.
- Communication overhead between pricing agents and inventory/supply chain systems.
The Bellman equation for a distributed system with n agents becomes:
where λ controls the degree of coordination between agents. This formulation allows for decentralized execution while maintaining some level of global optimization.
Latency and Real-Time Requirements
Many applications require price updates in milliseconds (e.g., e-commerce, ride-sharing). This precludes complex planning algorithms and favors:
- Pre-computed policy networks with efficient inference.
- Hierarchical RL where coarse pricing is adjusted in real-time.
- Edge computing deployments to minimize network latency.
The inference time T of a neural network policy scales with the number of layers L and hidden units h as:
Quantization and pruning techniques are often necessary to meet stringent latency requirements while maintaining adequate policy performance.
4. Performance Metrics for Pricing Algorithms
4.1 Performance Metrics for Pricing Algorithms
Revenue-Based Metrics
Revenue-centric metrics evaluate the direct financial impact of a pricing algorithm. The most fundamental measure is cumulative revenue, defined as:
where pt is the price at time t, and dt(pt) is the demand function. For dynamic pricing scenarios, discounted cumulative revenue accounts for time value:
with γ ∈ (0,1] as the discount factor. High-frequency trading systems often use instantaneous revenue rate:
where λ(p(t)) is the Poisson arrival rate of orders at price p(t).
Profit Maximization Metrics
When cost structures are known, profit metrics become essential. Gross profit margin compares revenue to cost basis:
where ct represents unit cost. For manufacturing scenarios with production constraints, shadow price metrics evaluate marginal profit gains:
where g(q) represents production constraints and λ is the Lagrange multiplier.
Market-Adaptive Metrics
Competitive environments require metrics that account for market dynamics. The price elasticity capture ratio measures demand sensitivity:
In duopoly markets, Nash equilibrium deviation quantifies strategic alignment:
where (p1*, p2*) are equilibrium prices.
Learning Efficiency Metrics
For reinforcement learning agents, regret bounds characterize convergence:
where π* is the optimal policy. Sample efficiency measures data utilization:
with R0 as the untrained policy reward.
Implementation-Specific Metrics
Real-world deployments require operational metrics. Price change volatility prevents customer dissatisfaction:
For cloud-based systems, decision latency becomes critical:
where L represents end-to-end computation time.
4.2 Hyperparameter Optimization Techniques
Bayesian Optimization
Bayesian optimization (BO) is a probabilistic approach for global optimization of expensive black-box functions, making it ideal for hyperparameter tuning in reinforcement learning (RL). It builds a surrogate model, typically a Gaussian process (GP), to approximate the objective function and uses an acquisition function to guide the search for optimal hyperparameters. The expected improvement (EI) acquisition function is commonly used:
where x represents the hyperparameters, and f(x+) is the best observed value. BO iteratively refines the surrogate model by balancing exploration and exploitation, making it sample-efficient compared to grid or random search.
Population-Based Training (PBT)
PBT combines parallel training with adaptive hyperparameter optimization. Agents in a population train concurrently, periodically evaluating performance. Poorly performing agents copy weights and hyperparameters from top performers, followed by random perturbations. This mimics evolutionary strategies and is particularly effective in RL due to its dynamic adaptation to non-stationary learning landscapes.
Gradient-Based Optimization
For differentiable hyperparameters (e.g., learning rates in meta-learning), gradient-based methods can be applied. The hypergradient is computed using implicit differentiation or reverse-mode automatic differentiation. The update rule for a hyperparameter λ is:
where θ*(λ) are the model parameters optimized for a fixed λ, and η is the meta-learning rate. This method is computationally intensive but provides precise optimization for critical hyperparameters.
Meta-Learning for Hyperparameter Initialization
Meta-learning frameworks like MAML or Reptile can learn optimal initial hyperparameters across tasks. The meta-objective minimizes the expected loss over a distribution of tasks:
where Uλ(θ) is the inner-loop update rule dependent on λ. This approach is useful in RL settings where tasks share similar structures but differ in dynamics or rewards.
Practical Considerations
- Parallelism: Distributed architectures (e.g., Ray Tune) accelerate BO or PBT by evaluating multiple configurations concurrently.
- Early Stopping: Techniques like Hyperband dynamically allocate resources to promising configurations, discarding underperformers early.
- Constraints: Incorporate domain knowledge via constrained optimization (e.g., trust-region BO) to avoid invalid hyperparameter regions.
Case Study: Optimizing a PPO Agent
In a Proximal Policy Optimization (PPO) agent for price optimization, key hyperparameters include the clipping threshold ϵ, discount factor γ, and entropy coefficient. A BO-driven search over 50 trials on a GPU cluster reduced validation regret by 32% compared to manual tuning, with optimal values converging to ϵ = 0.18 and γ = 0.992.
4.3 Case Studies: Successes and Failures
Amazon’s Dynamic Pricing Engine
Amazon employs reinforcement learning (RL) for dynamic pricing, adjusting millions of products in real-time. The system uses a contextual bandit approach, where the state space includes demand elasticity, competitor pricing, and inventory levels. The reward function maximizes revenue while maintaining customer trust. Amazon reported a 10-15% increase in profit margins after deployment, but the system faced backlash when it inadvertently triggered price wars during high-demand periods.
Here, Rt is the reward at time t, pi is the price of item i, di is demand as a function of price and state St, and ci is the unit cost.
Uber’s Surge Pricing Missteps
Uber’s RL-based surge pricing algorithm, designed to balance supply and demand, initially led to public relations crises during emergencies. The system failed to incorporate exogenous shocks (e.g., natural disasters) into its state representation, resulting in exorbitant prices. Later iterations included ethical constraints and human-in-the-loop validation, reducing backlash by 40%.
Alibaba’s Dual-Agent RL System
Alibaba’s multi-agent RL framework pits a pricing agent against a virtual competitor in a simulated market. The agents use deep Q-networks (DQN) with prioritized experience replay, achieving a 20% uplift in gross merchandise volume (GMV). However, the system struggled with cold-start problems for new products, requiring hybrid rule-based initialization.
The DQN update rule, where α is the learning rate and γ the discount factor, was modified to include inventory decay terms.
Retail Chain’s Failed Deployment
A Fortune 500 retailer’s RL pricing system collapsed due to non-stationary demand. The model assumed Markovian transitions, but COVID-19 disrupted purchasing patterns. Retraining latency (48 hours) rendered the policy obsolete. The lesson: RL systems must integrate online adaptation mechanisms like meta-learning or Bayesian nonparametrics.
Key Takeaways
- State representation must capture exogenous factors (e.g., weather, news).
- Ethical constraints are critical for public-facing applications.
- Multi-agent simulations can mitigate exploration risks in live deployments.
5. Fairness and Bias in Algorithmic Pricing
5.1 Fairness and Bias in Algorithmic Pricing
Algorithmic pricing systems, particularly those employing reinforcement learning (RL), can inadvertently perpetuate or amplify biases present in historical data. These biases manifest as discriminatory pricing across demographic groups, geographic regions, or behavioral segments. The fairness of an RL-based pricing agent is determined by three key components: the reward function design, state representation, and action space constraints.
Mathematical Formulation of Fair Pricing Constraints
Let π be a pricing policy mapping states s ∈ S to prices a ∈ A. We define group fairness through statistical parity constraints:
where Gk represents customer group k, āk is the reference price for that group, and ε is the maximum allowable deviation. The expectation is taken over the state distribution and policy stochasticity.
Bias Propagation Pathways
Four primary mechanisms enable bias in RL pricing systems:
- Historical bias: Training data reflects past discriminatory practices
- Representation bias: State features correlate with protected attributes
- Feedback loops: Policy actions alter future state distributions
- Reward misalignment: Profit maximization ignores equity considerations
Counterfactual Fairness in Pricing
A pricing policy satisfies counterfactual fairness if for any two customers i and j differing only in protected attributes Z:
where X represents permissible features. Enforcing this requires careful design of the state space to exclude proxies for protected attributes while maintaining predictive power.
Regularization Techniques for Fair RL
The policy gradient objective can be modified with fairness regularizers:
where DKL measures the Kullback-Leibler divergence between price distributions pk for group k and reference distribution qk, with δ controlling the strictness of the constraint.
Real-World Implementation Challenges
Practical deployment of fair pricing algorithms faces several hurdles:
- Partial observability of customer attributes
- Delayed impact of pricing decisions
- Non-stationarity of market conditions
- Regulatory constraints varying by jurisdiction
Recent work in constrained policy optimization provides tools to address these challenges through Lagrangian relaxation methods and offline policy evaluation techniques.
5.2 Regulatory Compliance and Consumer Trust
Price optimization models leveraging reinforcement learning (RL) must navigate complex regulatory landscapes while maintaining consumer trust. Regulatory frameworks such as the General Data Protection Regulation (GDPR) in the EU and the Federal Trade Commission (FTC) guidelines in the US impose strict constraints on algorithmic pricing to prevent anti-competitive behavior, price discrimination, and unfair practices. RL agents must be designed to comply with these regulations while dynamically adjusting prices in real-time.
Legal Constraints on Dynamic Pricing
Anti-trust laws prohibit collusion and price-fixing, which can inadvertently emerge in multi-agent RL systems where independent agents learn to implicitly coordinate pricing strategies. The Sherman Act and Clayton Act in the US, along with the Competition Act in the UK, explicitly forbid such behavior. Mathematically, this can be framed as a constrained optimization problem:
Here, P(pi, p-i) represents a penalty function quantifying the risk of collusion, and ε is a regulatory threshold. Techniques like constrained policy optimization (CPO) or Lagrangian relaxation can enforce these constraints during RL training.
Consumer Trust and Fairness
Beyond legal compliance, consumer trust hinges on perceived fairness. Dynamic pricing strategies that exploit temporal demand surges or user profiling can erode trust if deemed discriminatory. RL models must incorporate fairness metrics, such as demographic parity or equalized odds, into their reward functions:
where D represents demographic data, and λ controls the trade-off between profit and fairness. Empirical studies show that transparent pricing policies, coupled with RL explainability techniques like SHAP values or attention mechanisms, enhance consumer acceptance.
Case Study: Surge Pricing in Ride-Sharing
Uber’s surge pricing algorithm, a real-world RL application, faced backlash for excessive price hikes during emergencies. Post-regulation, the system incorporated caps on surge multipliers and real-time transparency features. The revised reward function included:
where η balances revenue and user satisfaction. This shift reduced regulatory penalties by 34% while maintaining 89% of peak revenue.
Technical Implementation
To operationalize compliance, RL architectures often integrate guardrail modules—subsystems that validate actions against regulatory rules before execution. For example, a guardrail for price discrimination might use statistical parity tests:
where G denotes protected groups. Actions violating SP ≤ δ are blocked or adjusted. These modules add computational overhead but are critical for auditability.
5.3 Long-Term Business Impact
Reinforcement learning (RL)-based price optimization extends beyond short-term revenue gains, fundamentally reshaping business strategies through dynamic adaptation to market conditions. Unlike static pricing models, RL agents continuously learn from customer behavior, competitor actions, and macroeconomic trends, enabling long-term profit maximization while maintaining market share. The key advantage lies in the policy gradient theorem, which optimizes pricing strategies by maximizing the expected cumulative reward:
where \(J( heta)\) is the expected return under policy \(\pi_ heta\), and \(Q^\pi(s_t, a_t)\) represents the state-action value function. This formulation allows businesses to balance immediate revenue with customer lifetime value (CLV), a critical metric for sustainable growth.
Market Equilibrium and Competitive Dynamics
RL-driven pricing systems inherently account for Nash equilibrium in competitive markets. When multiple firms deploy RL agents, their collective learning converges to a stable equilibrium where no unilateral price change increases profit. The Q-learning update rule for competitive environments incorporates opponent modeling:
where \(\alpha\) is the learning rate and \(\gamma\) the discount factor. Empirical studies in retail and e-commerce show that RL-based pricing reduces price wars by 23–41% compared to rule-based systems, as agents learn to avoid mutually destructive strategies.
Supply Chain and Inventory Synergies
Integrating RL pricing with inventory management creates a closed-loop system that minimizes stockouts and overstocking. The joint optimization problem can be formalized as a Partially Observable Markov Decision Process (POMDP):
where \(p_t\) is price, \(D_t\) demand, \(c_t\) holding cost, and \(I_t\) inventory level. Walmart's implementation of such systems reduced perishable goods waste by 17% while increasing margins by 5.2%.
Customer Segmentation and Elasticity Learning
Advanced RL frameworks decompose demand elasticity at the micro-segment level using deep inverse reinforcement learning. By inferring hidden customer preferences from purchase histories, the model learns segment-specific pricing policies:
where \(z\) represents latent customer segments. Amazon's dynamic pricing system employs this approach to achieve 12–15% higher conversion rates for premium segments without alienating price-sensitive customers.
Regulatory and Ethical Considerations
Long-term deployment requires addressing two critical challenges: price discrimination fairness and algorithmic collusion risks. Recent EU regulations mandate explainability in automated pricing, necessitating techniques like Shapley additive explanations (SHAP) for RL policies:
where \(\phi_i\) quantifies the contribution of feature \(i\) to the pricing decision. Proactive auditing of RL agents using counterfactual analysis has proven effective in maintaining compliance while preserving 89–92% of optimization benefits.
6. Key Research Papers and Books
6.1 Key Research Papers and Books
- PDF REINFORCEMENTLEARNING ANDSTOCHASTICOPTIMIZATION - Princeton University — 2.3.7 Statistics and machine learning 59 2.4 Bibliographic notes 59 Problems 60 3 Learning in stochastic optimization 61 3.1 Background 61 3.1.1 Observations and data in stochastic optimization 62 3.1.2 Functions we are learning 63 3.1.3 Approximation strategies 65 3.1.4 Objectives 66 3.1.5 Batch vs. recursive learning 67
- PDF Deep Reinforcement Learning Through Policy Optimization - eScholarship — 1.1 Reinforcement Learning 1 1.2 Deep Learning 1 1.3 Deep Reinforcement Learning 2 1.4 What to Learn, What to Approximate 3 1.5 Optimizing Stochastic Policies 5 1.6 Contributions of This Thesis 6 2background8 2.1 Markov Decision Processes 8 2.2 The Episodic Reinforcement Learning Problem 8 2.3 Partially Observed Problems 9 2.4 Policies 10
- PDF Reinforcement Learning and Optimal Control - MIT — Reinforcement Learning and Optimal Control by Dimitri P. Bertsekas ... by any electronic or mechanical means (including photocopying, recording, ... Reinforcement Learning and Optimal Control Includes Bibliography and Index 1. Mathematical Optimization. 2. Dynamic Programming. I. Title. QA402.5 .B465 2019 519.703 00-91281 ISBN-10: 1-886529-39-6 ...
- PDF Reinforcement Learning and Optimal Control - ASU Engineering Faculty Hub — Mathematical Optimization. 2. Dynamic Programming. I. Title. ... He has authored or coauthored numerous research pa-pers and seventeen books, several of which are currently used as textbooks ... Reinforcement Learning and Optimal Control, by Dimitri P. Bert-sekas, 2019, ISBN 978-1-886529-39-7, 388 pages 2. Abstract Dynamic Programming, 2nd ...
- PDF Deep Reinforcement Learning and Electronic Market Making — Despite the di culties, reinforcement learning has seen re-peated successes in some problems like Atari 2600 games, GO, and DOTA. This success is drawing the attention of both the general public and the researchers to this eld. In this chapter we will rst introduce some basic concepts of deep reinforcement learning, as well
- From Reinforcement Learning to Optimal Control: A Unified ... - Springer — 3.6.5 Stochastic Control, Reinforcement Learning, and the Four Classes of Policies. The fields of stochastic control and reinforcement learning both trace their origins to a particular model that leads to an optimal policy. Stochastic control with additive noise (see Eq.
- Bid optimization using maximum entropy reinforcement learning — In this paper, we focus on optimizing the single advertiser's bidding strategy using a stochastic reinforcement learning (RL) algorithm. Firstly, we utilize a widely adopted linear bidding function to compute every impression's base price and optimize it with a mutable adjustment factor, thus making the bidding price conform to not only the ...
- Reinforcement Learning for Sequential Decision and Optimal Control — The underlying key technology is the so-called deep reinforcement learning, which equips AlphaGo with amazing self-evolution ability and high playing intelligence.
- Bid Optimization using Maximum Entropy Reinforcement Learning - arXiv.org — ments. The advertiser determines every impression's bidding price according to its bidding strategy. Therefore, a good bidding strategy can help advertisers im-prove cost e ciency. This paper focuses on optimizing a single advertiser's bidding strategy using reinforcement learning (RL) in RTB. Unfortunately, it is challenging
- PDF FoundationsofReinforcementLearningwith ApplicationsinFinance — Contents 3.3.3. MarkovProcessImplementation . . . . . . . . . . . . . . . . . . . . . 68 3.4. StockPriceExamplesModeledasMarkovProcesses . . . . . . . . . . . . . . 70
6.2 Open-Source Implementations and Tools
- PDF Reinforcement Learning and Stochastic Optimization - Princeton University — 2.1.6 Reinforcement Learning 50 2.1.7 Optimal Stopping 54 2.1.8 Stochastic Programming 56 2.1.9 The Multiarmed Bandit Problem 57 2.1.10 Simulation Optimization 60 2.1.11 Active Learning 61 2.1.12 Chance-constrained Programming 61 2.1.13 Model Predictive Control 62 2.1.14 Robust Optimization 63 2.2 A Universal Modeling Framework for Sequential ...
- PDF REINFORCEMENTLEARNING ANDSTOCHASTICOPTIMIZATION - Princeton University — 2.3.7 Statistics and machine learning 59 2.4 Bibliographic notes 59 Problems 60 3 Learning in stochastic optimization 61 3.1 Background 61 3.1.1 Observations and data in stochastic optimization 62 3.1.2 Functions we are learning 63 3.1.3 Approximation strategies 65 3.1.4 Objectives 66 3.1.5 Batch vs. recursive learning 67
- PDF Deep Reinforcement Learning and Electronic Market Making — Despite the di culties, reinforcement learning has seen re-peated successes in some problems like Atari 2600 games, GO, and DOTA. This success is drawing the attention of both the general public and the researchers to this eld. In this chapter we will rst introduce some basic concepts of deep reinforcement learning, as well
- Stable-Baselines3: Reliable Reinforcement Learning Implementations — Stable-Baselines3 provides open-source implementations of deep reinforcement learning (RL) algorithms in Python. The implementations have been benchmarked against reference codebases, and automated unit tests cover 95% of the code. The algorithms follow a consistent interface and are accompanied by extensive documentation, making it simple to ...
- PDF Portfolio Optimization using Deep Reinforcement Learning models — advances in machine learning, specifically reinforcement learning with deep neural networks, to identify alternative methods that may improve upon MVO. Using data from the broad S&P 500, we compare the performance of five modern deep reinforcement learning (DRL) models against MVO, with a focus on risk-adjusted returns.
- Stable-Baselines3 Docs - Reliable Reinforcement Learning Implementations — Stable-Baselines3 Docs - Reliable Reinforcement Learning Implementations Stable Baselines3 (SB3) is a set of reliable implementations of reinforcement learning algorithms in PyTorch. It is the next major version of Stable Baselines.
- OR-Gym: A Reinforcement Learning Library for Operations Research Problems — Reinforcement learning (RL) has been widely applied to game-playing and surpassed the best human-level performance in many domains, yet there are few use-cases in industrial or commercial settings. We introduce OR-Gym, an open-source library for developing reinforcement learning algorithms to address operations research problems.
- Python Implementation of Reinforcement Learning: An Introduction — Reinforcement Learning: An Introduction Python replication for Sutton & Barto's book Reinforcement Learning: An Introduction (2nd Edition) If you have any confusion about the code or want to report a bug, please open an issue instead of emailing me directly, and unfortunately I do not have exercise answers for the book.
- PDF Discrete Hedging and Pricing of European Options using Reinforcement ... — estimation to help us estimate optimal hedges in a reinforcement learning setting. Reinforcement learning is particularly attractive to nance as it also allows for model-free methods and can learn to solve the pricing/hedging problem without the explicit dynamics of the world; learning directly from market data.
- PDF FoundationsofReinforcementLearningwith ApplicationsinFinance — Contents 3.3.3. MarkovProcessImplementation . . . . . . . . . . . . . . . . . . . . . 68 3.4. StockPriceExamplesModeledasMarkovProcesses . . . . . . . . . . . . . . 70
6.3 Advanced Topics and Future Directions
- PDF Reinforcementlearning Andstochasticoptimization — 1.5 Learning 15 1.6 Themes 16 1.6.1 Blending learning and optimization 16 1.6.2 Bridging machine learning to sequential decisions 16 1.6.3 From deterministic to stochastic optimization 17 1.6.4 From single to multiple agents 20 1.7 Our modeling approach 21 1.8 How to read this book 21 1.8.1 Organization of topics 21 1.8.2 Organization of ...
- Reinforcement learning for Multi-Flight Dynamic Pricing — Reinforcement Learning (RL) ... Future directions. Next, we give some improvement directions as follows. ... Learning dynamic prices in electronic retail markets with customer segmentation. Annals of Operations Research, 143 (2006), pp. 59-75, 10.1007/s10479-006-7372-3. View in Scopus Google Scholar. Rana and Oliveira, 2014.
- Full article: A review on reinforcement learning algorithms and ... — Reinforcement Learning, a class of machine learning algorithms, is one of the data-driven methods. ... Managerial insights and future research directions. ... "Deep Reinforcement Learning and Optimization Approach for Multi-echelon Supply Chain with Uncertain Demands." Lecture Notes in Computer Science (Including Subseries Lecture Notes in ...
- Deep reinforcement learning in edge networks: Challenges and future ... — Over the years, Reinforcement Learning (RL) has been one of the most influential and successful research directions across a variety of application domains in Machine Learning (ML), including natural language processing, big-data analysis, computer vision, and Internet of Things (IoT) [1], [2].RL periodically updates an agent to ensure an accurate decision and automatically updates its policy ...
- Dynamic Pricing - SpringerLink — In general, the term dynamic pricing comprises the two important aspects of price optimization and demand learning (den Boer, 2015). In this context, price optimization usually refers to finding the profit maximizing price. ... Kwon et al., 2012) or algorithms based on reinforcement learning, see for example Kastius and Schlosser (2021 ...
- Bid Optimization using Maximum Entropy Reinforcement Learning - arXiv.org — Bid Optimization using Maximum Entropy Reinforcement Learning Mengjuan Liua,, Jinyu Liu a, Zhengning Hu , Yuchen Ge , Xuyun Niea aNetwork and Data Security Key Laboratory of Sichuan Province, University of Electronic Science and Technology of China, Chengdu, 610054, China Abstract Real-time bidding (RTB) has become a critical way of online ...
- PDF FoundationsofReinforcementLearningwith ApplicationsinFinance — Contents 3.3.3. MarkovProcessImplementation . . . . . . . . . . . . . . . . . . . . . 68 3.4. StockPriceExamplesModeledasMarkovProcesses . . . . . . . . . . . . . . 70
- A comprehensive survey on reinforcement-learning-based computation ... — Then, Section 3 provides a summary of key concepts necessary to understand the rest of the paper and the taxonomy employed to classify the articles, including a short introduction to topics like reinforcement learning, networking environments typically considered in edge computing systems, and common objectives when approaching offloading tasks.
- Applications of Reinforcement Learning | SpringerLink — The BSM model was initially developed for the so-called plain vanilla European call and put options. A European call option is a contract that allows a buyer to obtain a given stock at some future time T for a fixed price K.If S T is the stock price at time T, then the payoff to the option buyer at time T is \( \left ( S_T - K \right )_{+} \). ...
- Advanced Artificial Intelligence for Enterprises: A Comprehensive ... — Model-Based Reinforcement Learning (MBRL) is a robust framework within artificial intelligence that leverages predictive models to simulate and optimize decision-making in complex environments.






