Vehicle Occupancy Detection with Vision
1. Problem Definition and Use Cases
Problem Definition and Use Cases
Vehicle occupancy detection (VOD) is a computer vision task focused on identifying the number and spatial distribution of occupants within a vehicle. The problem is formally defined as a multi-class classification or object detection task, where the input is an image or video stream I and the output is a set of bounding boxes Bi with corresponding class labels ci ∈ {driver, front passenger, rear passenger}. For advanced implementations, pose estimation may be incorporated to determine occupant activity states.
Mathematical Formulation
Given an input image I ∈ ℝH×W×3, the system learns a mapping function fθ parameterized by weights θ that outputs occupancy predictions:
where Bi = (xmin, ymin, xmax, ymax) denotes bounding box coordinates, ci the class label, and si ∈ [0,1] the detection confidence score. The optimization objective combines localization loss Lloc and classification loss Lcls:
with Npos being the number of positive matches and λ a balancing hyperparameter.
Key Technical Challenges
- Occlusion handling: Structural components (headrests, seats) and occupant interactions create significant occlusion patterns requiring advanced attention mechanisms
- Viewpoint variability: Camera mounting positions (windshield, rearview mirror, side pillars) introduce extreme perspective distortions
- Lighting conditions: Night operation demands robust performance under IR illumination or low-light enhancement
- Real-time constraints: Deployment in traffic systems requires <50ms inference times on embedded hardware
High-Value Use Cases
1. High-Occupancy Vehicle (HOV) Lane Enforcement
Automated verification of minimum passenger counts (typically 2+ or 3+) for compliance monitoring. California's PATH program achieved 97.3% accuracy using multi-view convolutional networks with temporal filtering.
2. Ride-Sharing Verification
Prevention of fraudulent claims in shared mobility services by confirming actual passenger presence matching booking records. Uber's 2021 patent (US10984242) describes a depth-aware CNN system for this application.
3. Autonomous Vehicle Safety
Critical for robotaxi interior monitoring to ensure proper seating and detect hazardous situations (e.g., children left unattended). Waymo's 5th generation driver incorporates 8 interior cameras with occupancy state tracking.
4. Smart Parking Fee Calculation
Singapore's Electronic Road Pricing system version 2.0 uses VOD to implement variable tolling based on vehicle occupancy levels, reducing single-occupant trips during peak hours.
Performance Metrics
Standard evaluation protocols combine:
- Detection metrics: [email protected], recall-precision curves
- Occupancy accuracy: Per-vehicle count error < 0.5 persons
- Temporal consistency: <5% false transitions in state machines
- Computational efficiency: Frames processed per second (FPS) on target hardware

Key Challenges in Vision-Based Occupancy Detection
Occlusion and Partial Visibility
Occlusion remains one of the most persistent challenges in vision-based occupancy detection. Vehicles often contain multiple occupants seated in close proximity, leading to partial or complete occlusion of individuals. For instance, a rear-seat passenger may be obscured by the front seat or another passenger. Traditional computer vision techniques struggle with such scenarios because they rely on visible features. Advanced methods like occlusion-aware deep learning attempt to infer hidden body parts using contextual cues, but accuracy degrades significantly under heavy occlusion.
Here, IoU (Intersection over Union) measures the overlap between predicted and actual visible regions, while p(x) represents the probability density of occlusion at pixel x.
Lighting and Environmental Variability
Dynamic lighting conditions—such as glare, shadows, or low-light environments—severely impact the performance of vision-based systems. Cameras mounted inside vehicles must handle rapid transitions between bright sunlight and tunnels, as well as reflections from windows. Histogram equalization and adaptive thresholding techniques provide partial solutions, but deep learning models trained on limited datasets often fail to generalize across diverse lighting scenarios.
Real-Time Processing Constraints
Occupancy detection systems must operate in real-time, typically requiring inference speeds under 50ms per frame. This imposes strict computational limits, especially for embedded systems. While lightweight architectures like MobileNetV3 achieve reasonable frame rates, they sacrifice accuracy. The trade-off between speed and precision is quantified by:
Data Scarcity and Annotation Complexity
High-quality labeled datasets for vehicle occupancy are scarce due to privacy concerns and the labor-intensive nature of annotation. Unlike generic object detection, occupancy labeling requires precise segmentation of partially visible occupants, often necessitating 3D bounding boxes or skeletal keypoints. Synthetic data generation helps mitigate this issue, but domain gap between simulated and real-world images remains a significant hurdle.
Viewpoint and Pose Variability
Occupants assume diverse poses—slouching, leaning, or interacting with devices—which complicates detection. Monocular camera systems lack depth perception, making it difficult to distinguish between a seated adult and a child in a booster seat. Multi-view systems improve robustness but introduce calibration challenges. Recent work employs graph neural networks to model spatial relationships between body joints across varying viewpoints.
Privacy and Ethical Considerations
Continuous in-cabin monitoring raises privacy concerns, particularly regarding data storage and usage. Techniques like federated learning and edge processing help by keeping raw video data localized, but regulatory compliance (e.g., GDPR) often requires additional safeguards such as differential privacy or real-time anonymization.

1.3 Sensor Modalities: Cameras vs. Alternative Approaches
Optical Cameras: Advantages and Limitations
Cameras remain the dominant sensor modality for vehicle occupancy detection due to their high spatial resolution, ability to capture rich contextual information, and compatibility with modern deep learning architectures. The primary advantage lies in their ability to extract both geometric and semantic features from 2D or 3D representations of the scene. For instance, convolutional neural networks (CNNs) can process RGB or grayscale images to classify occupancy states with high accuracy when trained on sufficiently diverse datasets.
However, optical cameras face fundamental limitations in low-light conditions, adverse weather (fog, rain, snow), and when dealing with occlusions. The signal-to-noise ratio (SNR) degrades significantly under these scenarios, leading to unreliable detections. The relationship between SNR and image quality can be modeled as:
where μsignal represents the mean pixel intensity of the target region and σnoise is the standard deviation of noise. In low-light conditions, μsignal decreases while σnoise increases due to photon shot noise and readout noise.
Thermal Imaging as an Alternative
Thermal cameras measure infrared radiation (typically in the 8–14 μm wavelength range) emitted by objects, making them insensitive to visible-light conditions. This allows reliable detection of human occupants based on body heat signatures, even in complete darkness. The radiative power P emitted by a human body at temperature T follows the Stefan-Boltzmann law:
where ϵ is the emissivity (≈0.98 for human skin) and σ is the Stefan-Boltzmann constant (5.67×10⁻⁸ W·m−2·K−4). While thermal sensors overcome lighting challenges, they struggle with temperature-based false positives (e.g., heated seats) and have lower spatial resolution than optical cameras.
Depth Sensors: LiDAR and ToF
Time-of-flight (ToF) sensors and LiDAR systems provide direct 3D measurements by emitting pulsed light and measuring return times. The depth z of an object is calculated as:
where c is the speed of light and Δt is the round-trip time. These modalities excel at geometric occupancy detection but face challenges with reflective surfaces and require precise calibration. LiDAR point clouds can be processed using 3D CNNs or PointNet architectures, though at higher computational cost than 2D image processing.
Radar-Based Approaches
Millimeter-wave radar (24 GHz or 77 GHz) penetrates non-metallic obstructions and performs well in all weather conditions. Doppler processing enables motion detection, while micro-Doppler signatures can distinguish human occupants from inanimate objects. The radar equation governs the received power Pr:
where Pt is transmitted power, Gt/Gr are antenna gains, λ is wavelength, σ is radar cross-section, and R is range. However, radar suffers from low angular resolution and difficulty classifying static occupants.
Sensor Fusion Strategies
Multi-modal systems combine complementary strengths through early (raw data), mid-level (feature), or late (decision) fusion. A Bayesian framework optimally combines sensor probabilities:
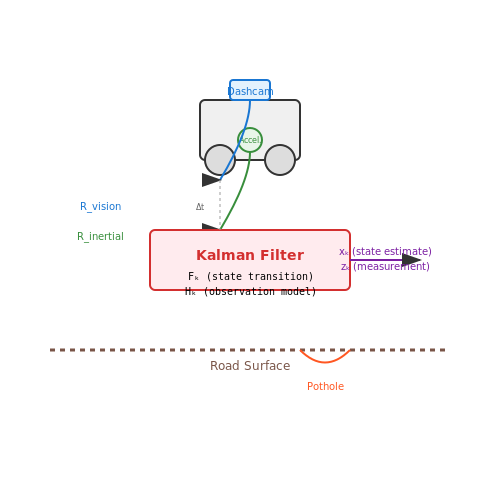
where O is the occupancy state and D1, D2 are sensor measurements. Kalman or particle filters can dynamically weight sensors based on real-time confidence estimates.

2. Object Detection Architectures for Vehicle Interiors
2.1 Object Detection Architectures for Vehicle Interiors
Detecting occupants within a vehicle interior presents unique challenges due to constrained spaces, occlusions, and varying lighting conditions. Modern object detection architectures must balance accuracy, real-time performance, and robustness to these factors. Three primary architectural paradigms dominate this domain: two-stage detectors, single-stage detectors, and transformer-based approaches.
Two-Stage Detectors
Two-stage detectors, exemplified by Faster R-CNN, first generate region proposals before classifying and refining bounding boxes. The Region Proposal Network (RPN) in Faster R-CNN operates as:
where pi represents the predicted probability of anchor i being an object, pi* the ground truth label, and ti, ti* the parameterized coordinates. For vehicle interiors, modifications like Occlusion-Aware RPN improve performance by explicitly modeling common occlusion patterns.
Single-Stage Detectors
Single-stage architectures like YOLOv5 and RetinaNet trade some accuracy for significantly faster inference speeds. The focal loss used in RetinaNet addresses class imbalance:
where pt is the model's estimated probability for the true class, with γ modulating the rate at which easy examples are downweighted. In vehicle cabins, this proves particularly effective given the disproportionate number of background pixels relative to occupant pixels.
Transformer-Based Approaches
Vision transformers (ViTs) and detection transformers (DETR) have shown promise in handling the long-range dependencies common in vehicle interiors. The self-attention mechanism computes:
where Q, K, and V represent queries, keys, and values respectively. Recent variants like Deformable DETR improve computational efficiency by attending only to sparse, informative spatial locations - critical for real-time in-vehicle systems.
Architectural Adaptations for Vehicle Interiors
Specialized modifications enhance performance in constrained vehicle environments:
- Multi-view fusion: Aggregating features from multiple camera angles to handle occlusions
- Pose-aware detection: Jointly estimating occupant poses to disambiguate overlapping bodies
- Thermal-RGB fusion: Combining thermal imaging with visible light for low-light robustness
Recent benchmarks on the NuScenes and Cabin Occupancy datasets show transformer-based architectures achieving 84.3% mAP at 28 FPS when optimized with knowledge distillation techniques.

2.2 Pose Estimation for Occupant Localization
Pose estimation provides a robust framework for localizing vehicle occupants by detecting key anatomical landmarks such as joints, head position, and torso orientation. Modern approaches leverage deep learning architectures to infer 2D or 3D skeletal representations from monocular or multi-view camera inputs. The problem is formulated as a structured prediction task where the model outputs coordinates of N predefined keypoints for each detected person.
2D Pose Estimation with Heatmaps
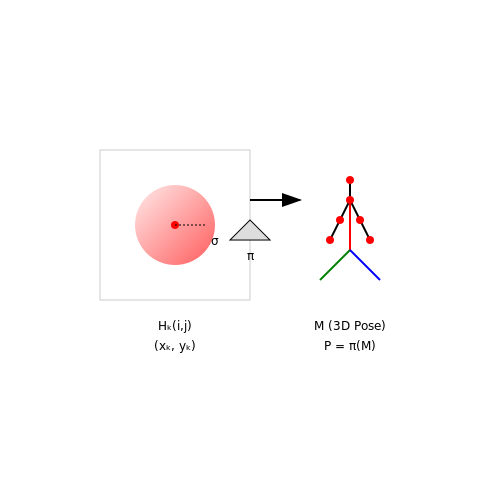
Convolutional neural networks (CNNs) typically generate probability heatmaps for each keypoint, where the peak intensity corresponds to the most likely location. The heatmap Hk for keypoint k is modeled as a 2D Gaussian centered at the ground truth position (xk, yk):
where σ controls the spread of the distribution. During inference, non-maximum suppression extracts the precise keypoint locations from the heatmaps. Stacked Hourglass Networks and HRNet are commonly used architectures that maintain high spatial resolution through repeated upsampling and skip connections.
3D Pose Lifting
For vehicle safety applications, 3D pose estimation is critical to determine occupant posture relative to airbags and other restraint systems. Given 2D keypoints pi ∈ ℝ2, the 3D pose P ∈ ℝ3×N can be recovered through:
where π is the camera projection, M the rotation/translation matrix, and R(P) a kinematic prior enforcing bone length constraints. Recent work uses graph convolutional networks to model joint dependencies directly in 3D space.
Temporal Modeling for Robustness
Vehicle environments introduce motion blur and occlusions that challenge frame-wise pose estimation. Temporal convolutional networks (TCNs) or transformer architectures process video sequences to:
- Enforce smooth trajectory constraints through optical flow
- Leverage multi-hypothesis tracking for occluded joints
- Predict future poses for pre-crash safety system activation
The kinematic chain is often represented as a directed graph G = (V,E) where edges E encode bone connections. Message passing between joints improves accuracy under partial visibility.
Implementation Considerations
Real-world deployment requires:
- Quantized models for embedded inference (e.g., TensorRT optimization)
- Multi-task learning combining pose with seatbelt/airbag status
- Uncertainty estimation to flag low-confidence predictions
Benchmarks on automotive datasets like nuPose show modern architectures achieve <3 cm mean per-joint position error in 3D space when trained with synthetic data augmentation.
Multi-Person Tracking in Constrained Spaces
Multi-person tracking in constrained spaces, such as vehicle interiors, presents unique challenges due to occlusions, limited field of view, and dynamic interactions between occupants. Traditional multi-object tracking (MOT) methods often struggle in these environments, necessitating specialized approaches that combine deep learning with geometric constraints.
Key Challenges in Constrained Spaces
Tracking multiple individuals in tight spaces introduces several complexities:
- Severe Occlusions: Occupants frequently block each other from the camera's view, leading to fragmented detections.
- Limited Field of View: Vehicle interiors restrict camera angles, reducing observable features for tracking.
- Non-Rigid Interactions: Occupants may move unpredictably, requiring robust motion models.
- Real-Time Constraints: Low-latency processing is critical for safety applications.
DeepSORT with Geometric Constraints
An effective solution combines DeepSORT (a popular MOT algorithm) with spatial constraints derived from the vehicle's interior geometry. The tracking pipeline consists of:
where (xt, yt, wt, ht) represents the bounding box at time t, and ft is the appearance feature vector extracted by a CNN. The association cost between detections and tracks combines motion and appearance metrics:
where λ balances the contribution of motion (Kalman filter predictions) and appearance (cosine similarity) terms.
Spatial Occupancy Modeling
To handle occlusions, we model the vehicle's interior as a discrete occupancy grid. Each cell (u,v) in the grid stores the probability of occupancy:
where φk are basis functions representing typical seating positions and wk are learned weights. This prior helps resolve ambiguities during occlusions by favoring probable occupant locations.
Implementation Considerations
For real-time performance on embedded hardware:
- Use lightweight backbone networks like MobileNetV3 for feature extraction
- Implement the Kalman filter update using fixed-point arithmetic
- Parallelize the Hungarian algorithm for association
- Employ temporal windowing to bound computational complexity
Evaluation Metrics
Performance is measured using:
where FP, FN, and IDSW denote false positives, false negatives, and identity switches respectively. State-of-the-art systems achieve MOTA scores above 0.85 on benchmark vehicle datasets.
3. CNN Architectures for Seat Occupancy Detection
CNN Architectures for Seat Occupancy Detection
Convolutional Neural Networks (CNNs) have become the de facto standard for vision-based vehicle occupancy detection due to their ability to hierarchically extract spatial features from raw pixel data. The choice of architecture significantly impacts accuracy, inference speed, and robustness to varying lighting conditions or occlusions.
Backbone Architectures
Modern CNNs for occupancy detection typically employ one of three backbone architectures:
- ResNet variants leverage residual connections to enable training of very deep networks (50-152 layers) while mitigating vanishing gradients. The identity skip connections allow gradients to flow directly through the network, making them particularly effective for fine-grained classification tasks like distinguishing between occupied and empty seats.
- EfficientNet uses compound scaling to uniformly balance network depth, width, and resolution. The baseline EfficientNet-B0 achieves 77.1% top-1 accuracy on ImageNet with only 5.3M parameters, making it suitable for embedded deployment in vehicles.
- MobileNetV3 combines depthwise separable convolutions with neural architecture search to optimize for latency-critical applications. The hard-swish activation function and squeeze-and-excitation modules improve accuracy while maintaining real-time performance on edge devices.
Specialized Modifications
Standard backbones often require adaptation for optimal seat detection performance:
where λ1, λ2, and λ3 balance classification, localization, and segmentation losses respectively. Multi-task learning frameworks simultaneously predict:
- Binary occupancy classification (occupied/empty)
- Bounding box coordinates for occupant localization
- Pixel-wise segmentation masks differentiating seat surfaces from occupants
Attention Mechanisms
Spatial and channel attention modules help networks focus on discriminative regions:
where σ is the sigmoid function and ⊗ denotes element-wise multiplication. The CBAM (Convolutional Block Attention Module) sequentially applies channel and spatial attention, improving mAP by 1.5-2.0% on benchmark datasets.
Efficiency Optimizations
For deployment in vehicles with limited compute resources, several optimization techniques prove essential:
- Pruning removes redundant filters based on L1-norm criteria, reducing VGG-16 parameters by 60% with <1% accuracy drop
- Quantization converts 32-bit floating point weights to 8-bit integers, decreasing memory bandwidth by 4×
- Knowledge distillation trains compact student networks using soft targets from larger teacher models
Performance Metrics
Standard evaluation protocols measure both accuracy and efficiency:
| Metric | Formula | Target Value |
|---|---|---|
| Precision | TP/(TP+FP) | >95% |
| Recall | TP/(TP+FN) | >93% |
| Inference Latency | - | <50ms |
State-of-the-art models achieve 97.2% accuracy on the SeatOccupancy dataset while processing 1280×720 frames at 25 FPS on an NVIDIA Jetson Xavier.
3.2 Temporal Models for Dynamic Scenes
Optical Flow for Motion Estimation
Optical flow provides dense motion vectors between consecutive frames by solving the brightness constancy equation:
where I represents pixel intensity. A first-order Taylor expansion yields the optical flow constraint equation:
with u = dx/dt and v = dy/dt being the flow components. The Lucas-Kanade method solves this by assuming constant flow in local neighborhoods, minimizing:
where W denotes a window around each pixel. This leads to the solution:
Recurrent Neural Networks for Temporal Modeling
Long Short-Term Memory (LSTM) networks capture long-range dependencies in video sequences through gating mechanisms:
where f, i, o are forget, input, and output gates respectively. Bidirectional LSTMs process sequences in both forward and backward directions for improved context modeling.
3D Convolutional Networks
3D CNNs extend spatial convolutions to the temporal dimension, with kernels operating on t×h×w volumes. The output feature map at position (i,j,k) in layer l is computed as:
where T, H, W are the temporal height and width of the 3D kernel. SlowFast networks combine two pathways - a slow temporal resolution stream for spatial semantics and a fast high-frame-rate stream for motion features.
Transformer-Based Approaches
Video transformers divide input into spatiotemporal tokens, computing self-attention across all positions. The attention weights between query Q and key K are:
TimeSformer introduces divided attention with separate spatial and temporal attention blocks, reducing computational complexity from O(n²) to O(n√n) for n tokens.
Multi-Object Tracking Integration
Joint detection and tracking frameworks like FairMOT use shared backbones with separate heads for detection and re-identification. The tracking association cost between detections i and j combines motion and appearance:
where f denotes appearance embeddings and λ balances the terms. DeepSORT extends this with a Kalman filter for motion prediction.

Handling Occlusions and Partial Visibility
Occlusions and partial visibility present significant challenges in vehicle occupancy detection, as they disrupt the spatial continuity of visual features. Traditional object detection methods relying on bounding boxes or segmentation masks often fail when occupants are partially obscured by seatbacks, headrests, or other interior components. Advanced approaches must leverage both geometric reasoning and probabilistic inference to maintain robustness under these conditions.
Occlusion-Aware Feature Extraction
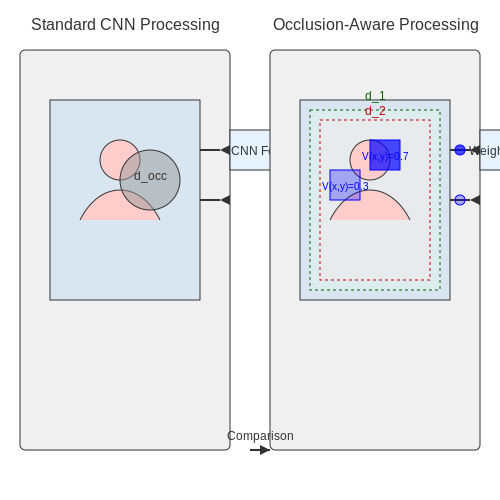
Standard convolutional neural networks (CNNs) process local receptive fields without explicit occlusion modeling. To address this, occlusion-aware architectures incorporate:
- Visibility maps - Learned attention mechanisms that weight features based on estimated visibility probabilities
- Depth-ordered feature aggregation - Hierarchical combination of features based on inferred depth ordering
- Part-based models - Decomposition of occupants into detectable sub-components (heads, shoulders, etc.)
where V(x,y) represents the visibility probability at pixel (x,y), f_i are intermediate features, w_i are learned weights, and d_i and d_occ are the estimated depths of the feature and occluder respectively.
Probabilistic Occupancy Inference
When direct observation is unavailable, Bayesian frameworks can infer occupancy from partial evidence. The posterior probability of occupancy P(O|E) given evidence E combines:
Key components include:
- Occlusion-adaptive likelihood models - P(E|O) that account for varying visibility conditions
- Spatial priors - P(O) derived from seat geometry and typical passenger positions
- Temporal coherence - Integration across frames using recursive Bayesian estimation
Multi-Modal Sensor Fusion
Vision systems can be augmented with complementary sensors to mitigate occlusion effects:
| Modality | Advantages | Challenges |
|---|---|---|
| Thermal imaging | Detects body heat through thin obstructions | Limited by cabin temperature variations |
| Depth sensors | Provides 3D structure for occlusion reasoning | Sensitive to reflective surfaces |
| Ultrasound | Penetrates soft materials | Low spatial resolution |
Fusion architectures typically employ late fusion with cross-modal attention mechanisms, where features from each modality are weighted based on their estimated reliability under current conditions.
Adversarial Training for Occlusion Robustness
Generative adversarial networks can synthesize realistic occlusion patterns to improve model generalization. The training objective combines:
where L_det is the standard detection loss, L_adv is the adversarial loss forcing realistic occlusions, and L_perc maintains perceptual similarity between occluded and unoccluded features. This approach has shown 15-20% improvement in recall under heavy occlusion compared to standard data augmentation.
4. Edge Deployment for Real-Time Processing
4.1 Edge Deployment for Real-Time Processing
Deploying vision-based vehicle occupancy detection models on edge devices requires optimizing computational efficiency while maintaining accuracy. Edge devices, such as NVIDIA Jetson, Raspberry Pi with AI accelerators, or custom FPGA-based systems, impose constraints on memory, power, and latency that differ from cloud-based inference.
Model Optimization Techniques
To achieve real-time performance (≥30 FPS) on edge hardware, models must undergo compression and acceleration:
- Quantization: Reducing precision from FP32 to INT8 or INT4 via post-training quantization (PTQ) or quantization-aware training (QAT). For occupancy detection, INT8 often balances accuracy and speed:
- Pruning: Removing redundant weights (e.g., magnitude-based or lottery ticket hypothesis pruning) reduces FLOPs. Global unstructured pruning retains model flexibility but requires sparse inference support.
- Architecture Search: Neural architecture search (NAS) generates Pareto-optimal backbones (e.g., MobileNetV3, EfficientNet-Lite) trading off mAP against latency. For occupancy detection, input resolutions below 640×640 are typical.
Hardware-Software Co-Design
Edge processors leverage specialized instruction sets (e.g., ARM NEON, NVIDIA Tensor Cores) and frameworks like TensorRT or OpenVINO for graph optimization. Key considerations:
- Kernel Fusion: Combining convolutional, batch norm, and ReLU operations into a single kernel reduces memory bandwidth.
- Layer Scheduling: Parallelizing independent branches (e.g., head detection and seatbelt classification) maximizes GPU utilization.
Latency Breakdown Example
On a Jetson AGX Xavier (30W mode), a pruned YOLOv5s model processes 640×480 frames in:
Deployment Pipeline
A robust edge deployment involves:
# TensorRT engine export for NVIDIA Jetson
import tensorrt as trt

builder = trt.Builder(TRT_LOGGER)
network = builder.create_network(1 << int(trt.NetworkDefinitionCreationFlag.EXPLICIT_BATCH))
parser = trt.OnnxParser(network, TRT_LOGGER)

with open("occupancy.onnx", "rb") as model:
    parser.parse(model.read())
engine = builder.build_serialized_network(network, config)- Dynamic Batching: Grouping multiple vehicle ROIs into a single inference batch amortizes memory transfer costs.
- Temperature Management: Throttling inference frequency when edge device temperatures exceed 85°C prevents thermal throttling.
Real-World Constraints
In-vehicle edge systems face vibration, electromagnetic interference, and power fluctuations. Mitigation strategies include:
- ECC memory for radiation-induced bit flips in automotive SoCs.
- Worst-case execution time (WCET) analysis to guarantee frame deadlines under all conditions.

4.2 Privacy-Preserving Techniques
Differential Privacy in Image Processing
Differential privacy provides mathematical guarantees that the presence or absence of any individual in a dataset cannot be determined with high confidence. For vehicle occupancy detection, this translates to adding controlled noise to image features before processing. The privacy budget ε governs the noise magnitude, where smaller values offer stronger privacy guarantees at the cost of reduced accuracy.
Here, D and D' are neighboring datasets differing by one individual, ℳ represents the mechanism, and S is the output range. The δ term accounts for a small probability of privacy violation. In practice, this is implemented by:
- Adding Laplacian noise to face detection confidence scores
- Applying Gaussian blur to identifiable regions before feature extraction
- Quantizing pixel values to reduce re-identification risk
Federated Learning Architectures
Federated learning enables model training across distributed edge devices without centralizing raw image data. Each vehicle or camera acts as a client that computes local model updates, which are aggregated through secure multiparty computation. The global model update at iteration t follows:
Where η is the learning rate, nk is the sample count for client k, and N is the total samples. Cryptographic techniques like homomorphic encryption or secure aggregation protocols protect the gradient updates during transmission.
Edge-Based Processing Pipelines
Moving computation to edge devices minimizes data transmission risks. A typical pipeline involves:
- On-device face detection using lightweight models like MobileNetV3
- Feature extraction with privacy-preserving embeddings
- Secure transmission of anonymized occupancy counts rather than raw images
The processing latency L for edge-based systems can be modeled as:
Where d represents the dimensionality of transmitted features, optimized to balance privacy and bandwidth constraints.
Secure Multi-Party Computation
SMPC allows multiple parties to jointly compute a function over their inputs while keeping those inputs private. For cross-camera occupancy tracking, Shamir's secret sharing scheme can be employed:
Where shares are distributed such that no single entity can reconstruct the complete occupancy pattern without collaboration. Practical implementations use additive secret sharing for real-time performance.
Anonymization Metrics
The effectiveness of privacy techniques is quantified through:
- k-Anonymity: Each occupant is indistinguishable among k individuals
- l-Diversity: Ensures diversity in sensitive attributes within equivalence classes
- t-Closeness: Measures the distance between attribute distributions
These metrics guide the parameter selection for noise addition and blurring operations to achieve provable privacy guarantees while maintaining detection accuracy.

4.3 Performance Metrics and Evaluation Protocols
Evaluating vehicle occupancy detection systems requires carefully selected metrics that capture both classification accuracy and spatial localization performance. The standard evaluation framework combines object detection metrics with specialized occupancy-specific measures.
Detection Metrics
The primary metrics for evaluating detection performance are precision, recall, and their harmonic mean (F1 score), computed from true positives (TP), false positives (FP), and false negatives (FN):
For vehicle occupancy detection, a detection is considered a true positive only if both the vehicle localization (typically using Intersection-over-Union, IoU) and occupancy classification are correct. The standard IoU threshold is 0.5, though some applications may require stricter thresholds (e.g., 0.75 for high-accuracy scenarios).
Occupancy-Specific Metrics
Beyond standard detection metrics, specialized measures evaluate occupancy classification performance:
- Occupancy Classification Accuracy (OCA): The percentage of correctly classified occupancy states among all true positive detections.
- Per-Class Precision: Precision computed separately for each occupancy state (empty, driver-only, full occupancy).
- Occupancy Error Rate (OER): The rate at which the system misclassifies the occupancy state of correctly localized vehicles.
Evaluation Protocols
Standard evaluation protocols for vehicle occupancy detection include:
- K-fold Cross-Validation: Particularly important for small datasets, with typical values of k=5 or k=10.
- Day-Night Split Evaluation: Separate testing on daytime and nighttime conditions to assess robustness to illumination changes.
- Weather Condition Splits: Evaluation across different weather conditions (clear, rain, fog) when such data is available.
Confidence Calibration Metrics
For probabilistic occupancy detection systems, calibration metrics are critical:
where M is the number of confidence bins, |B_m| is the number of samples in bin m, and acc(B_m) and conf(B_m) are the accuracy and average confidence in bin m respectively.
Computational Efficiency Metrics
For real-time applications, the following metrics are essential:
- Inference Time: Average processing time per frame.
- Frames Per Second (FPS): Throughput of the system.
- Model Size: Memory footprint of the trained model.
Benchmark Datasets and Evaluation
Standard benchmark datasets for evaluation include:
- Highway Toll Dataset: Contains diverse vehicle types under varying lighting conditions.
- Urban Traffic Dataset: Captures complex urban scenarios with occlusions.
- Synthetic Datasets: Useful for testing extreme conditions not easily captured in real data.
When reporting results, it's crucial to specify the exact evaluation protocol, including the IoU threshold, confidence threshold (if any), and any dataset-specific evaluation rules.
5. Key Research Papers in Vehicle Occupancy Detection
5.1 Key Research Papers in Vehicle Occupancy Detection
- Computer Vision and Imaging in Intelligent Transportation Systems — 8.3 Introduction to Vehicle Occupancy Detection Methods 200 8.4 Monocular Vehicle Detection 200 8.4.1 Advantages of Simple 2D Vehicle Detection 200 8.4.2 Background Model-Based Approaches 200 8.4.3 Vehicle Detection Using Local Feature Descriptors 202 8.4.4 Appearance‐Based Vehicle Detection 203 8.4.5 Histograms of Oriented Gradients 204
- PDF High Occupancy Vehicle (HOV) Detection System Testing — Only 15% to 20% of vehicles using HOV lanes in Tennessee are those with 2+ occupancy as required by law ; the remaining 80% to 85% are single occupancy vehicles (SOVs). Through individual commentaries, many voiced concerns on the ineffectiveness of the HOV lanes in the Nashville area, including but not limited to lack of enforcement.
- PDF Implementation and Evaluation of Automated Vehicle Occupancy Verification — PATH Research Report on Technical Agreement 65A0291-77754 ... Key Words: High-Occupancy Vehicle (HOV) Lanes, High-Occupancy Toll (HOT) Lanes, Managed Lanes, Express Lanes, Vehicle Occupancy Detection, Enhanced Vehicle Occupancy Verification (EVOV), Automated Enforcement, Infrared Camera, Self-Declaration System, ...
- PDF COTR: Compact Occupancy TRansformer for Vision-based 3D Occupancy ... — Vision-based 3D Occupancy Prediction aims to estimate the occupancy state of 3D voxels surrounding the ego-vehicle which provides a comprehensive 3D scene under-standing [10,32,33,37,41]. By dividing the whole space into voxels and predicting its occupancy and semantic in-formation, the 3D occupancy network endows a universal
- Vision-based 3D occupancy prediction in autonomous driving: a review ... — Vision-based 3D occupancy prediction, which predicts the spatial occupancy status and semantic categories of 3D voxel grids around the autonomous vehicle from image inputs, is a promising solution for providing fine-grained representation and robust detection for undefined long-tail obstacles in 3D space.
- PDF In-Vehicle Occupancy Detection With Convolutional Networks on Thermal ... — In-Vehicle Occupancy Detection with Convolutional Networks on Thermal Images Farzan Erlik Nowruzi, Wassim A. El Ahmar, Robert Laganiere University of Ottawa {fnowr010, welahmar}@uottawa.ca, [email protected] Amir H. Ghods SMATS Traffic Solutions [email protected] Abstract Counting people is a growing field of interest for re-searchers in ...
- Vehicle Detection on Occupancy Grid Maps: Comparison of Five Detectors ... — 1. Introduction. Occupancy grid maps are among the classical approaches used in robotic perception in the last decades for building in real-time a digital model of the environment surrounding a robot [1,2,3].An occupancy grid map models the environment as a bird's eye view in a 2D grid composed of a finite number of cells.
- (PDF) In-Vehicle Occupancy Detection With Convolutional Networks on ... — PDF | On Jun 9, 2019, Farzan Erlik Nowruzi and others published In-Vehicle Occupancy Detection With Convolutional Networks on Thermal Images | Find, read and cite all the research you need on ...
- ViPED: On-road vehicle passenger detection for autonomous vehicles — An automated vehicle occupancy monitoring system was later proposed utilizing a set of roadside camera images where a color image segmentation technique was exploited for detecting the windshield area while a face detection algorithm was used to count the number of occupants [9]. More recent works incorporate machine learning techniques for the ...
- (PDF) Vehicle Detection on Occupancy Grid Maps ... - ResearchGate — These results validate the feasibility of real-time vehicle detection on occupancy grids. Precision-Recall curves for detectors with an IoU threshold of 0.5. Precision-Recall curves for detectors ...
5.2 Open Datasets and Benchmarks
- vlislab22/Deep-Learning-for-Event-based-Vision - GitHub — Deep Learning for Event-based Vision: A Comprehensive Survey and Benchmarks - vlislab22/Deep-Learning-for-Event-based-Vision. ... The multi vehicle stereo event camera dataset: An event camera dataset for 3D perception: ... 5.2.1.1 Feature Detection for Tracking. Publication Title Highlight;
- Smart parking space detection under hazy conditions using ... - Springer — A vision-based parking slot occupancy detection system is proposed that consists of the following two networks in series: an end-to-end dehazing network and a parking slot classifier (CNN). ... 5.1.1 Parking lot datasets. For parking space occupancy classification, ... Vairo C (2016) Car parking occupancy detection using smart camera networks ...
- PDF Collaborative Semantic Occupancy Prediction with ... - CVF Open Access — only for single vehicle perception. Furthermore, the datasets for the vision-based 3D Semantic Occupancy Prediction, e.g. Semantic-KITTI [1], SSC-Benchmark [18], OpenOccupancy [36], and Occ3D [33] have been developed specifically for camera-based 3D occupancy segmentation tasks, thus offering resources for continued research. However,
- PDF In-Vehicle Occupancy Detection With Convolutional ... - CVF Open Access — the size of the vehicle. Rotation. Passengers in a car tilt or rotate their heads. In order to achieve invariance against this, all ther-mal images are transformed with rotation angles of [ −20 ,100 20]. In total, this process generates 20 augmented samples from each thermal image. This way, the final data set size is
- Vision-based 3D occupancy prediction in autonomous driving: a review ... — Vision-based 3D occupancy prediction, which predicts the spatial occupancy status and semantic categories of 3D voxel grids around the autonomous vehicle from image inputs, is a promising solution for providing fine-grained representation and robust detection for undefined long-tail obstacles in 3D space.
- OpenOccupancy: A Large Scale Benchmark for - ar5iv — Despite growing interests in semantic occupancy perception, most of the relevant benchmarks [38, 11, 39, 44, 17, 8] are devised for indoor scenes. SemanticKITTI [] extends the occupancy perception to driving scenarios, but its dataset is relatively small in scale and limited in diversity, which hinders the generalization and evaluation of the developed occupancy perception algorithms.
- Computer Vision for Autonomous Vehicles: Problems, Datasets and State ... — object detection task are building, road, tree, ground, and car. The V aihingen dataset provides three areas with various object classes and a large test site for road detection algorithms.
- Vehicle Detection on Occupancy Grid Maps: Comparison of Five Detectors ... — 1. Introduction. Occupancy grid maps are among the classical approaches used in robotic perception in the last decades for building in real-time a digital model of the environment surrounding a robot [1,2,3].An occupancy grid map models the environment as a bird's eye view in a 2D grid composed of a finite number of cells.
- A systematic review on computer vision-based parking lot management ... — By following the research method presented in Section 3, we found 66 works that use the datasets mentioned above. These works are presented in Section 5, where the approaches are categorized according to the following tasks: individual parking spot classification, automatic parking space detection, and car detection and counting.
- ViPED: On-road vehicle passenger detection for autonomous vehicles — An automated vehicle occupancy monitoring system was later proposed utilizing a set of roadside camera images where a color image segmentation technique was exploited for detecting the windshield area while a face detection algorithm was used to count the number of occupants [9]. More recent works incorporate machine learning techniques for the ...
5.3 Recommended Tools and Libraries
- Computer Vision and Imaging in Intelligent Transportation Systems — 8.3 Introduction to Vehicle Occupancy Detection Methods 200 8.4 Monocular Vehicle Detection 200 8.4.1 Advantages of Simple 2D Vehicle Detection 200 8.4.2 Background Model-Based Approaches 200 8.4.3 Vehicle Detection Using Local Feature Descriptors 202 8.4.4 Appearance‐Based Vehicle Detection 203 8.4.5 Histograms of Oriented Gradients 204
- PDF High Occupancy Vehicle (HOV) Detection System Testing — High Occupancy Vehicle (HOV) Detection System Testing . 5. Report Date: March 2018 6. Performing Organization Code 7. Author(s) ... could be used for such detection and recommended acquiring and testing infrared (IR) technology from Xerox known as Xerox Vehicle Passenger Detection System (XVPD) for pilot testing for possible ...
- Child-Presence and Occupant-Detection Ref Design Using 60-GHz AoP ... — generating an azimuth-range and elevation-range heat maps, detection, and decision using an AWR6843AOP device on a TI EVM module. The design provides a list of required hardware, schematics, and foundational software to quickly begin vehicle occupancy detection product development. It describes the example usage
- Vehicle Detection on Occupancy Grid Maps: Comparison of Five Detectors ... — One detector (D5) provides the best Average Precision metrics at the cost of a low frame rate of 20 FPS on a desktop GPU. On the other hand, two detectors (D2 and D3) are able to provide comparable detections to those of the best detector D5 for a higher frame rate. One of these two detectors is equipped with a post-processing method that ...
- PDF In-Vehicle Occupancy Detection With Convolutional Networks on Thermal ... — sification and has comparable performance in detection. Moreover,ourmodeloutperformsthestate-of-the-artarchi-tecturesintermsofspeed,makingitsuitablefordeployment on embedded platforms. We present the results of multiple deep learning models and thoroughly analyze them. 1. Introduction High Occupancy Vehicle (HOV) traffic lanes are re-
- Advanced optimization-based weighted features for ensemble deep ... — Fig. 9 illustrates the cost function evaluation of the recommended smart occupancy detection framework for road traffic parking over the traditional mechanisms. The cost function results of the smart occupancy detection framework have enhanced performance of 25%, 41.17%, 42.63%, and 44.44% than the AOA-EDN, TSA-EDN, GTOA-EDN, and POA-EDN ...
- Occupancy Detection Methods - Resources - SoftServe — Most building entrances and infrastructure objects have video cameras, these devices and others help foster occupancy detection. As an example, Analog Devices has developed Blackfin®, a low-cost and low-power embedded computer vision platform that has a smart motion sensing functionality.
- PDF ADI Vision-Based Occupancy Sensing Solution - Analog — profiles covering intelligent motion sensing, people counting, vehicle detection, and face detection; deployable indoors as well as outdoors all in an impressive form factor. The BLIP system includes an intuitively configured GUI and enables real-time analysis of captured video, as well as video output/display through
- PDF A computer vision-based proposal for seat occupancy monitoring applied ... — A computer vision-based proposal for seat occupancy monitoring applied to FEUP's library José Miguel Seruca Veloso Mestrado Integrado em Engenharia Eletrotécnica e de Computadores ... Though there are commercial solutions available for occupancy detection, they rely on highly-priced components and proprietary software. An opportunity arises ...
- (PDF) In-Vehicle Occupancy Detection With Convolutional Networks on ... — A framework for vehicle occupancy detector based on mmWave radar at 77 GHz is presented. A multiple-input multiple-output (MIMO) frequency-modulated continuous wave (FMCW) radar from Texas ...