


NSLU2

Description: Aquaponics systems require good water quality, with the pH value needing to remain within a specific range for both fish and plants to thrive. This is also applicable to fish-only aquariums, but the focus here is on an existing aquaponics system. A blog post discusses using Debian on an NSLU2 with a USB hard disk and Homeplug network. The NSLU2 computer features a USB connector, and by utilizing a DS9490R1-Wire to USB adapter, data can be collected from a 1-Wire unit onto a hard disk. A pH-to-1-Wire adapter is intended to be built and described in future blog posts. The 1-Wire bus offers a longer reach than USB, which is beneficial for various applications. The pH probe connected to a voltage amplifier outputs 0.059 V per pH unit, and using a coax cable helps reduce noise interference. The coax cable typically terminates in a BNC connector. The voltage signal from the pH probe can be both positive (pH < 7) and negative (pH > 7). To accommodate this, the ground reference for the voltage amplifier is raised, ensuring only positive voltages are sent to an A/D converter, which usually only processes positive voltages. The NSLU2 computer requires minimal maintenance, consistent with many Linux servers, and features low power consumption and a compact form factor. Automatic graph generation occurs, and prior to modifying scripts, it is advisable to disable these automatic functions via Debian's crontab by commenting out the command lines. The crontab can be edited using the nano editor, and a data set for rain data is needed to generate graphs. An old database is deleted, and the rain parameter is incorporated into the database generation script. The counter data from the rain gauge circuit is not formatted, and the rainread variable is directly used in calculations. A file named rain_count.txt stores the counter value from five minutes prior, allowing the calculation of rainfall over that interval. Each tick of the rain gauge represents 0.25 mm of rain, and the total rainfall is derived by multiplying the number of ticks by this value.
The described aquaponics system necessitates careful monitoring of water quality, particularly the pH levels, which can significantly influence the health of aquatic and plant life. The integration of a pH-to-1-Wire adapter facilitates the connection of a pH probe to the 1-Wire bus, enabling efficient data collection and monitoring. The pH probe's output is a low voltage signal, which requires amplification and proper signal conditioning to ensure accurate readings. The use of coaxial cable for the connection minimizes electromagnetic interference, which is crucial for maintaining signal integrity over longer distances.
The voltage amplifier circuit must be designed to handle both positive and negative signals from the pH probe. By raising the ground reference, the circuit can effectively convert the varying pH levels into a format suitable for the A/D converter, ensuring that the data remains within the acceptable input range. The A/D converter's output can then be processed by the NSLU2, which runs a Debian-based operating system, allowing for data logging and analysis.
The NSLU2's low power consumption and compact design make it an ideal choice for continuous operation in an aquaponics setup. The automated graph generation feature, managed through crontab, simplifies data visualization, allowing users to monitor trends in pH levels and other environmental factors over time. The inclusion of rain data into the monitoring system adds another layer of environmental awareness, as precipitation can impact the overall water quality in the aquaponics system.
The process of calculating rainfall from the 1-Wire rain gauge is straightforward, relying on the previous counter value stored in rain_count.txt. By comparing this value to the current reading, the amount of rainfall over a specified period can be accurately determined. Each tick corresponds to a measurable amount of rain, allowing for easy conversion to millimeters. This data can be integrated into the overall monitoring system, providing valuable insights into how external weather conditions affect the aquaponics environment.
In summary, the described system demonstrates a comprehensive approach to monitoring and maintaining optimal water quality in aquaponics through the integration of various electronic components and software solutions.Aquaponics systems need a good water quality, and one of the parameters is pH value, which needs to be within a certain range in order for the fish and plants to thrive. This is of course also true for fish-only aquariums, but since I have an aquaponics system set up already, this is what I`ll focus on.
There are a few pictures of the system in th is blog post: Debian on NSLU2 With USB Hard Disk and Homeplug Network (I`m using a Debian NSLU2 but it should be possible to use an Unslung NSLU2 too). The small NSLU2 computer has a USB connector and with a DS9490R1-Wire to USB adapter it`s easy to collect data from a 1-Wire unit onto a hard disk.
Then I just need a pH-to-1-Wire adapter, which is what I want to build and describe in the upcoming blog posts. A 1-Wire bus has a much longer reach than a USB bus and that is very convenient for many purposes. The pH probe that is supposed to be connected to the voltage amplifier only sends out 0. 059 V per pH unit and using a coax cable will keep out noise. Coax cable naturally terminates in a BNC connector. The voltage signal coming from the pH probe is both positive (pH < 7) and negative (pH > 7). Since the power supply for the circuit is from an ordinary 12 VDC mains adapter and the signal is going to an A/D converter, the ground reference for the voltage amplifier is raised to ensure positive voltages only for the converter, assuming that a normal one is only able to handle positive voltages.
I can`t help checking the uptime when I log in. I`m still amazed by how little maintenance this small NSLU2 computer requires. This is usually the case with Linux servers, but on top of that is has low power consumption and small form factor I almost forget that it`s there. Generation of graphs happens automatically so before making any changes to the scripts, I prefer disabling the automatic scripts.
This is done via Debian crontab, and I just put a hash` or number sign (#) in front of the command lines to comment them out: $ crontab -e # m h dom mon dow command # */5 * * * * /home/thomas/rrdtool/update_database. sh &> /dev/null # */5 * * * * /home/thomas/rrdtool/upload_graphs. sh Once you have done a crontab edit with the -e option, you can view crontab commands as they are at the moment with the -l option for crontab list.
You can format crontab listings as explained in the first line with the hash`. I`m using the nano editor when editing crontab. I want to generate graphs based on the rain data and for that I need a data set in the RRDtool database. The old database is deleted and the rain parameter is added to the database generation script: $ cd /home/thomas/rrdtool/ $ rm database.
rrd $ nano create_database. sh #!/bin/bash rrdtool create database. rrd -start N -step 300 DS:airtemp:GAUGE:600:U:U DS:soiltemp:GAUGE:600:U:U DS:soilmoist:GAUGE:600:U:U DS:rain:GAUGE:600:U:U RRA:AVERAGE:0. 5:1:12 RRA:AVERAGE:0. 5:1:288 RRA:AVERAGE:0. 5:12:168 RRA:AVERAGE:0. 5:12:720 RRA:AVERAGE:0. 5:288:365 There`s no formatting of the counter data from the circuit inside the rain gauge. The rainread variable is used directly in calculations. I have created a file called rain_count. txt, which contains the counter value as it was 5 minutes ago. This is the time between each execution of the script, so the old value is in a file, and the new value is read from the 1-Wire counter.
When these two values are subtracted you get the amount of rain in the last 5 minutes, but it`s in ticks, or number of buckets. Each tick represents 0. 25 mm of rain, and multiplied with the number of ticks, you get the total amount of rain in [mm]. Note that when you`re doing math in a Linux script, you can make up names for your variables, like rainbuckets, but when you want to use the content of a variable you have to use the dollar sign, like $rainbuckets, or else it will be interpreted as the text rainbucket`.
It doesn`t make sense to multiply a number
The described aquaponics system necessitates careful monitoring of water quality, particularly the pH levels, which can significantly influence the health of aquatic and plant life. The integration of a pH-to-1-Wire adapter facilitates the connection of a pH probe to the 1-Wire bus, enabling efficient data collection and monitoring. The pH probe's output is a low voltage signal, which requires amplification and proper signal conditioning to ensure accurate readings. The use of coaxial cable for the connection minimizes electromagnetic interference, which is crucial for maintaining signal integrity over longer distances.
The voltage amplifier circuit must be designed to handle both positive and negative signals from the pH probe. By raising the ground reference, the circuit can effectively convert the varying pH levels into a format suitable for the A/D converter, ensuring that the data remains within the acceptable input range. The A/D converter's output can then be processed by the NSLU2, which runs a Debian-based operating system, allowing for data logging and analysis.
The NSLU2's low power consumption and compact design make it an ideal choice for continuous operation in an aquaponics setup. The automated graph generation feature, managed through crontab, simplifies data visualization, allowing users to monitor trends in pH levels and other environmental factors over time. The inclusion of rain data into the monitoring system adds another layer of environmental awareness, as precipitation can impact the overall water quality in the aquaponics system.
The process of calculating rainfall from the 1-Wire rain gauge is straightforward, relying on the previous counter value stored in rain_count.txt. By comparing this value to the current reading, the amount of rainfall over a specified period can be accurately determined. Each tick corresponds to a measurable amount of rain, allowing for easy conversion to millimeters. This data can be integrated into the overall monitoring system, providing valuable insights into how external weather conditions affect the aquaponics environment.
In summary, the described system demonstrates a comprehensive approach to monitoring and maintaining optimal water quality in aquaponics through the integration of various electronic components and software solutions.Aquaponics systems need a good water quality, and one of the parameters is pH value, which needs to be within a certain range in order for the fish and plants to thrive. This is of course also true for fish-only aquariums, but since I have an aquaponics system set up already, this is what I`ll focus on.
There are a few pictures of the system in th is blog post: Debian on NSLU2 With USB Hard Disk and Homeplug Network (I`m using a Debian NSLU2 but it should be possible to use an Unslung NSLU2 too). The small NSLU2 computer has a USB connector and with a DS9490R1-Wire to USB adapter it`s easy to collect data from a 1-Wire unit onto a hard disk.
Then I just need a pH-to-1-Wire adapter, which is what I want to build and describe in the upcoming blog posts. A 1-Wire bus has a much longer reach than a USB bus and that is very convenient for many purposes. The pH probe that is supposed to be connected to the voltage amplifier only sends out 0. 059 V per pH unit and using a coax cable will keep out noise. Coax cable naturally terminates in a BNC connector. The voltage signal coming from the pH probe is both positive (pH < 7) and negative (pH > 7). Since the power supply for the circuit is from an ordinary 12 VDC mains adapter and the signal is going to an A/D converter, the ground reference for the voltage amplifier is raised to ensure positive voltages only for the converter, assuming that a normal one is only able to handle positive voltages.
I can`t help checking the uptime when I log in. I`m still amazed by how little maintenance this small NSLU2 computer requires. This is usually the case with Linux servers, but on top of that is has low power consumption and small form factor I almost forget that it`s there. Generation of graphs happens automatically so before making any changes to the scripts, I prefer disabling the automatic scripts.
This is done via Debian crontab, and I just put a hash` or number sign (#) in front of the command lines to comment them out: $ crontab -e # m h dom mon dow command # */5 * * * * /home/thomas/rrdtool/update_database. sh &> /dev/null # */5 * * * * /home/thomas/rrdtool/upload_graphs. sh Once you have done a crontab edit with the -e option, you can view crontab commands as they are at the moment with the -l option for crontab list.
You can format crontab listings as explained in the first line with the hash`. I`m using the nano editor when editing crontab. I want to generate graphs based on the rain data and for that I need a data set in the RRDtool database. The old database is deleted and the rain parameter is added to the database generation script: $ cd /home/thomas/rrdtool/ $ rm database.
rrd $ nano create_database. sh #!/bin/bash rrdtool create database. rrd -start N -step 300 DS:airtemp:GAUGE:600:U:U DS:soiltemp:GAUGE:600:U:U DS:soilmoist:GAUGE:600:U:U DS:rain:GAUGE:600:U:U RRA:AVERAGE:0. 5:1:12 RRA:AVERAGE:0. 5:1:288 RRA:AVERAGE:0. 5:12:168 RRA:AVERAGE:0. 5:12:720 RRA:AVERAGE:0. 5:288:365 There`s no formatting of the counter data from the circuit inside the rain gauge. The rainread variable is used directly in calculations. I have created a file called rain_count. txt, which contains the counter value as it was 5 minutes ago. This is the time between each execution of the script, so the old value is in a file, and the new value is read from the 1-Wire counter.
When these two values are subtracted you get the amount of rain in the last 5 minutes, but it`s in ticks, or number of buckets. Each tick represents 0. 25 mm of rain, and multiplied with the number of ticks, you get the total amount of rain in [mm]. Note that when you`re doing math in a Linux script, you can make up names for your variables, like rainbuckets, but when you want to use the content of a variable you have to use the dollar sign, like $rainbuckets, or else it will be interpreted as the text rainbucket`.
It doesn`t make sense to multiply a number

Objects in Flux
The Open Source Automation project is a free automation software that operates on Windows and does not require programming for setup. It features a user-friendly graphical interface and includes unique functionalities that are not typically found in high-end security and...
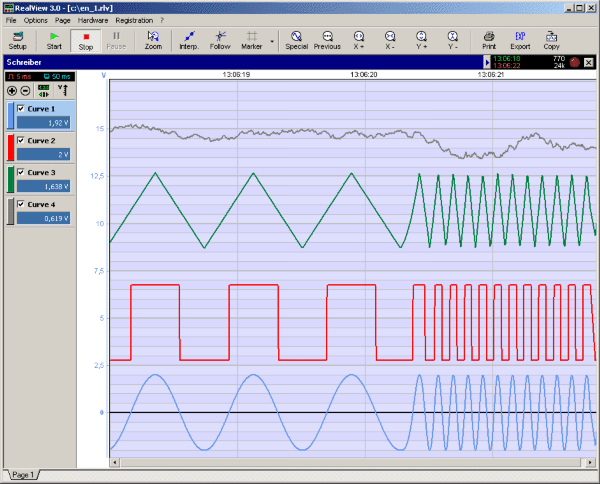
RealView 2.0
RealView is a measurement application, which records and plots measured values from analogue hardware devices in real-time. Several curves can be plotted into a single diagram. Several diagrams can be arranged on one or more pages if necessary. Plot options...

ProfiLab-Expert 4.0
The ProfiLab-Expert software allows you to develop your own digital or analogue measuring technology projects. It doesn't matter if you want to create analogue measurements or digital controls - you can realize it all. And for all this you don't...
ProfiLab-Expert 4.0
The ProfiLab-Expert software allows you to develop your own digital or analogue measuring technology projects. It doesn't matter if you want to create analogue measurements or digital controls - you can realize it all. And for all this you don't...

Aquarium incubator circuit diagram
The circuit features a 24V system with a 0.5W resistor functioning as a heating element (R7), which is embedded in a sand substrate within an aquarium. The heating element is connected to 24V bulbs at both ends. The resistor is...
RealView 2.0
RealView is a measurement application, which records and plots measured values from analogue hardware devices in real-time. Several curves can be plotted into a single diagram. Several diagrams can be arranged on one or more pages if necessary. Plot options...

Digital-ProfiLab 4.0
Digital-ProfiLab was designed for measurement and control applications, combining features like circuit and logic simulation, front panel design, and hardware control to one powerful tool. Incoming signals from external devices may be processed and displayed. A circuit editor is used...

Water quality checker project simple circuit diagram
How to measure water purity and test water quality using a simple electronics project. Water purity measurement and water quality analysis can be performed using a water purity checker circuit. This circuit is constructed around a Light Dependent Resistor (LDR)...

Coop automatic controller circuit diagram
The automatic controller for a chicken coop is designed to automatically regulate light, temperature, and humidity, thereby enhancing egg production and survival rates of chickens. This device is intended for specialized poultry households in rural areas. The circuit operates through...