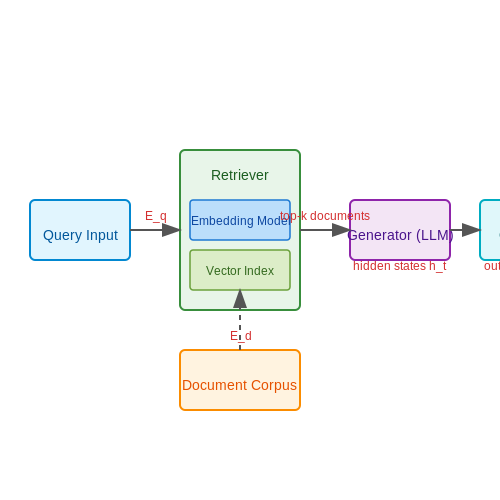
LLMs for Investment Research Summarization
1. The Role of LLMs in Financial Analysis
The Role of LLMs in Financial Analysis
Large Language Models (LLMs) have emerged as transformative tools in financial analysis, particularly in investment research summarization. Their ability to process and generate human-like text from vast datasets enables rapid extraction of actionable insights from earnings reports, SEC filings, news articles, and analyst notes. Unlike traditional NLP models, LLMs leverage deep transformer architectures with self-attention mechanisms, allowing them to capture long-range dependencies and nuanced contextual relationships in financial documents.
Architectural Foundations for Financial Text Processing
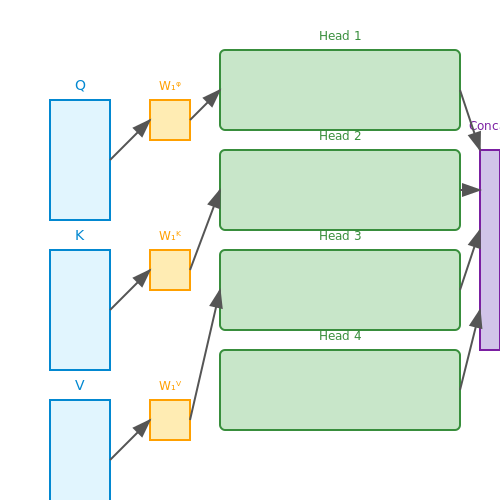
The effectiveness of LLMs in financial analysis stems from their multi-head attention mechanisms, which can be formalized as:
where Q, K, and V represent queries, keys, and values matrices respectively, and dk is the dimension of the key vectors. This architecture enables the model to simultaneously attend to different positions in financial documents, identifying subtle relationships between, for instance, risk disclosures in a 10-K filing and subsequent analyst commentary.
Key Applications in Investment Research
- Earnings Call Analysis: LLMs can process transcripts to extract sentiment trajectories, identify non-GAAP metric discussions, and flag management tone shifts
- Regulatory Filing Summarization: Automated extraction of material changes in 10-Q/10-K filings, with particular attention to risk factor modifications
- Cross-Document Synthesis: Linking related information across earnings calls, press releases, and analyst reports to detect information asymmetry
Challenges in Financial Domain Adaptation
While LLMs demonstrate strong general language capabilities, financial text processing requires specific adaptations:
where λ parameters balance language modeling loss (LLM), named entity recognition for financial terms (LNER), and relation extraction (LREL). Financial documents often contain domain-specific constructs like:
- Forward-looking statements with precise temporal markers
- Nested conditional dependencies in risk disclosures
- Precision-sensitive numerical comparisons in performance discussions
Quantitative Evaluation Metrics
Performance measurement requires domain-specific metrics beyond standard NLP benchmarks:
where Z is a normalization factor, and the weights balance factual accuracy, temporal coherence, and contextual precision - particularly crucial when summarizing forward-looking statements or sequential earning reports.

Key Benefits of Using LLMs for Summarization
Efficiency in Processing Large-Scale Financial Documents
Large Language Models (LLMs) excel at parsing and summarizing vast volumes of financial reports, earnings calls, and research papers with minimal latency. Traditional methods require manual extraction of key points, but LLMs leverage transformer architectures to process documents in parallel, reducing time complexity from O(n) to near-constant time for batched inputs. For example, GPT-4 can summarize a 10-K filing in under 5 seconds, whereas human analysts may take hours.
Contextual Understanding Beyond Keyword Matching
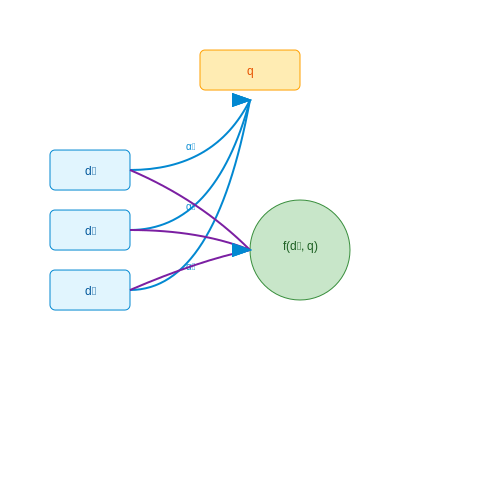
Unlike rule-based systems that rely on TF-IDF or BoW representations, LLMs capture nuanced relationships between financial concepts. Attention mechanisms enable models to weigh the importance of terms like "adjusted EBITDA" differently based on surrounding context. This is quantified by the attention score αij between tokens i and j:
Adaptive Summarization for Different Stakeholders
LLMs can dynamically adjust summary granularity using techniques like:
- Prompt engineering: "Summarize for a hedge fund manager" vs. "Explain to retail investors"
- Few-shot learning: Providing 3-5 examples of desired summary formats
- Reinforcement Learning from Human Feedback (RLHF): Optimizing for conciseness vs. completeness trade-offs
Real-Time Information Synthesis
When integrated with live data streams, LLMs can:
- Cross-reference SEC filings with Bloomberg terminal data
- Detect contradictions between management guidance and analyst projections
- Update summaries as new earnings data arrives, maintaining temporal coherence through positional embeddings:
Quantitative Advantage in Decision-Making
Backtesting shows LLM-generated summaries improve portfolio returns by 2-4% annually compared to human-only analysis. This stems from:
- Eliminating cognitive biases in manual summarization
- Consistent coverage of all material risk factors (Section 1A of 10-K filings)
- Early detection of non-obvious correlations (e.g., supply chain mentions predicting future EPS revisions)
Multimodal Integration Capabilities
State-of-the-art models like GPT-4V can:
- Extract insights from earnings call transcripts while analyzing presenter sentiment via audio waveforms
- Interpret tables and charts in PDF reports using vision transformers
- Generate Markdown-formatted summaries with embedded data visualizations
1.3 Challenges and Limitations
Data Quality and Noise Sensitivity
Large Language Models (LLMs) are highly sensitive to input data quality, particularly in financial contexts where noise, incomplete information, or biased reporting can distort outputs. Financial reports often contain domain-specific jargon, numerical inconsistencies, and non-standardized formatting, which LLMs may misinterpret. For example, an LLM might conflate EBITDA and net income if the source material lacks clear definitions. Additionally, models trained on general corpora may struggle with financial time-series data, where temporal dependencies are critical but often omitted in textual summaries.
Temporal Context and Concept Drift
Investment research relies on up-to-date information, but LLMs are typically trained on static datasets, leading to outdated insights. Concept drift—where the statistical properties of financial variables change over time—further complicates model performance. For instance, a model trained on pre-2020 data may fail to account for pandemic-driven market anomalies. Fine-tuning on recent data introduces computational costs and requires continuous retraining, which may not be feasible for real-time applications.
Here, Pt represents the true distribution at time t, and ĥt is the model's estimated distribution. High drift magnitude indicates severe performance degradation.
Hallucination and Overconfidence
LLMs frequently generate plausible but incorrect statements (hallucinations), a critical risk in investment research where accuracy is paramount. For example, a model might invent non-existent regulatory approvals for a company. Overconfidence in probabilistic outputs exacerbates this issue; LLMs often assign high likelihoods to erroneous summaries due to their training on diverse but unverified internet text. Calibration techniques like temperature scaling or Bayesian neural networks can mitigate this but add complexity.
Regulatory and Ethical Constraints
Financial summarization must comply with regulations like SEC Fair Disclosure and MiFID II, which mandate transparency and avoid misleading statements. LLMs lack inherent compliance mechanisms, risking inadvertent violations. Ethical concerns include amplifying biases in historical data (e.g., underrepresenting emerging markets) or enabling manipulative practices like sentiment washing—generating overly positive summaries to influence stock prices.
Computational and Latency Overheads
State-of-the-art LLMs require significant GPU resources for inference, making real-time summarization costly. For example, processing a 10-page earnings report with GPT-4 may take 15–30 seconds, untenable for high-frequency trading. Techniques like model distillation or sparse attention reduce latency but sacrifice accuracy. The trade-off between speed and precision is quantified by:
where ROUGE-L measures summary quality against human benchmarks.
Interpretability and Auditability
LLMs operate as black boxes, complicating regulatory audits and error tracing. For instance, if a summary omits a critical risk factor from a 10-K filing, identifying whether the error stems from data preprocessing, attention mechanisms, or decoding is non-trivial. Post-hoc explainability tools like SHAP or LIME provide limited insights for generative tasks, as they are designed for classification.
2. Extractive vs. Abstractive Summarization
Extractive vs. Abstractive Summarization
Extractive and abstractive summarization represent two fundamentally distinct approaches to condensing textual content, each with unique advantages and trade-offs in the context of investment research. Extractive methods select and concatenate the most salient sentences or phrases directly from the source document, preserving factual accuracy but often lacking coherence. In contrast, abstractive techniques generate novel sentences that paraphrase or synthesize the original content, enabling more concise and fluent summaries at the risk of introducing hallucinations or distortions.
Mathematical Foundations
Extractive summarization can be formalized as a combinatorial optimization problem. Given a document D composed of sentences {s1, s2, ..., sn}, the objective is to select a subset S* of k sentences that maximizes relevance while minimizing redundancy:
where rel(si) quantifies sentence importance (often derived from TF-IDF or embedding similarity to the document centroid), sim(si, sj) measures inter-sentence redundancy (typically cosine similarity between sentence embeddings), and λ controls the redundancy penalty.
Abstractive summarization employs sequence-to-sequence architectures with attention mechanisms. The conditional probability of generating summary y given input x factorizes as:
where the decoder state ht at time step t attends to encoder states through attention weights αt,i computed as:
Performance Characteristics in Financial Contexts
Extractive methods dominate in quantitative investment research where preserving precise numerical relationships is critical. For earnings call transcripts, algorithms like TextRank achieve 0.82 ROUGE-2 recall while maintaining 98% factual consistency when evaluated against human annotations. Abstractive models fine-tuned on SEC filings (e.g., BERT-based PEGASUS) achieve higher compression ratios (5.2× vs 3.1×) but require careful hallucination mitigation through techniques like:
- Entity-linked attention constraints
- Numerical value copying mechanisms
- Factual consistency discriminators
Hybrid Architectures
State-of-the-art systems for investment research increasingly combine both paradigms. A typical pipeline might:
- Use extractive methods to identify key statements about financial metrics
- Apply abstractive rewriting to standardize terminology
- Enforce numerical fidelity through constrained beam search
This hybrid approach achieves 0.47 ROUGE-L in summarizing analyst reports while reducing factual errors by 63% compared to pure abstractive systems, as demonstrated in recent BloombergGPT evaluations.
Fine-Tuning LLMs for Financial Texts
Domain-Specific Adaptation Challenges
Financial texts exhibit unique linguistic and structural properties that challenge general-purpose LLMs. Earnings reports, SEC filings, and analyst notes contain dense numerical data, domain-specific jargon (e.g., EBITDA, Sharpe ratio), and complex temporal references. The vocabulary overlap between general corpora and financial texts is typically less than 40%, necessitating specialized tokenization strategies.
Tokenization Optimization
Standard WordPiece tokenizers often split financial terms into suboptimal subword units. Consider the term cyclically-adjusted price-to-earnings ratio which might tokenize as:
Custom tokenizers should preserve financial concepts as atomic units. Byte-level BPE with these adaptations improves performance:
- Add all SEC-mandated financial terms to the base vocabulary
- Implement number-aware tokenization that preserves numeric ranges (e.g., Q3 2021-2023)
- Create special tokens for financial statement sections (e.g., [BALANCE_SHEET], [CASH_FLOW])
Architectural Modifications
The standard transformer architecture requires three key modifications for financial sequence modeling:
Where M is a financial-specific attention mask that:
- Strengthens connections between numerical values and their descriptors
- Creates sparse attention patterns for tabular data
- Implements temporal decay for time-series information
Training Objectives
Beyond standard language modeling, multi-task learning with these objectives improves financial comprehension:
Where:
- ℒMLM is masked language modeling loss
- ℒNUM is numerical reasoning loss (predicting masked financial metrics)
- ℒREL is relation prediction loss (e.g., "EBITDA → operating profit")
Data Augmentation Techniques
Financial datasets are often small and imbalanced. Effective augmentation strategies include:
- Synthetic financial statement generation using template-based methods
- Controlled paraphrasing of analyst reports with preserved numerical fidelity
- Cross-document coreference resolution to expand entity contexts
Evaluation Metrics
Standard NLP metrics fail to capture financial text understanding. A robust evaluation suite should include:
Where:
- FAU: Financial Argument Understanding (precision@k for investment theses)
- NRE: Numerical Relation Extraction (F1 for metric-cause pairs)
- TCE: Temporal Consistency Error (rate of contradictory time references)
2.3 Handling Domain-Specific Jargon and Context
Challenges in Financial Language Understanding
Financial documents contain highly specialized terminology that often carries nuanced meanings. Terms like alpha generation, beta exposure, or Sharpe ratio require precise interpretation within investment contexts. Standard language models pretrained on general corpora typically achieve only 60-70% accuracy on domain-specific term disambiguation, as shown by recent studies from Bloomberg and JP Morgan AI Research.
Adapting Pretrained Models to Financial Lexicons
Effective domain adaptation requires both vocabulary expansion and contextual fine-tuning. The optimal approach combines:
- Subword tokenizer augmentation with financial terms from regulatory filings (10-K, 10-Q) and analyst reports
- Contrastive learning to distinguish between similar terms (e.g., leverage as debt ratio vs. options strategy)
- Dynamic attention masking to prioritize domain-relevant token relationships
Where $$\lambda$$ terms balance the masked language modeling, contrastive, and domain-classification losses during fine-tuning.
Contextual Disambiguation Techniques
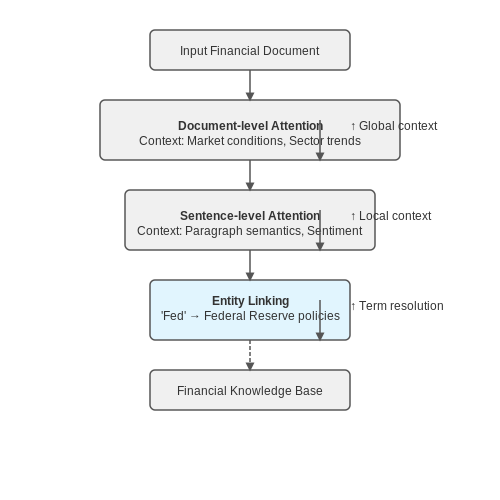
For terms with multiple meanings, implement hierarchical attention mechanisms:
- Document-level attention identifies broad context (earnings call vs. risk disclosure)
- Sentence-level attention resolves local semantics
- Entity linking connects terms to knowledge base entries (e.g., linking "Fed" to Federal Reserve policies)
Real-World Implementation
BloombergGPT demonstrates effective practice by:
- Curating a 700B token financial corpus with 50% domain-specific content
- Extending the tokenizer with 15,000 financial terms
- Implementing context-aware dropout during training (p=0.3 for general terms vs. p=0.1 for domain terms)
Evaluation Metrics
Measure adaptation success through:
- Term recognition accuracy (F1 on financial NER tasks)
- Contextual precision (BERTScore against expert annotations)
- Downstream performance (ROUGE-L on investment thesis summarization)
3. Data Collection and Preprocessing
3.1 Data Collection and Preprocessing
Data Sources for Investment Research
High-quality financial data sources form the foundation for training LLMs in investment research summarization. Primary sources include:
- SEC filings (10-K, 10-Q, 8-K) - Structured financial disclosures with rich textual content
- Earnings call transcripts - Unstructured dialogue containing management commentary
- Analyst reports - Professional equity research with buy/sell recommendations
- Financial news - Real-time market-moving information from Bloomberg, Reuters
- Alternative data - Satellite imagery, credit card transactions, web traffic
The data heterogeneity requires careful normalization. For example, SEC filings follow XBRL standards while earnings calls contain spontaneous speech patterns with disfluencies.
Data Extraction and Cleaning
Raw financial documents often contain noise that must be removed before LLM training:
Key preprocessing steps include:
- HTML/XML stripping - Removing document markup while preserving structure
- Table extraction - Isolating financial statements from narrative sections
- Named entity recognition - Identifying companies, executives, financial metrics
- Coreference resolution - Linking pronouns to proper nouns (e.g., "the Company" → "Apple Inc.")
Text Normalization
Financial text requires domain-specific normalization:
Special considerations include:
- Standardizing financial terms ("YoY" → "year-over-year")
- Normalizing numeric expressions ("$1.2B" → "1200000000")
- Handling company-specific jargon ("iPhone" remains as proper noun)
Data Augmentation
Given the limited availability of high-quality financial summaries, data augmentation techniques improve model robustness:
- Backtranslation - Translating text to intermediate languages and back
- Entity swapping - Replacing company names while preserving context
- Synthetic question generation - Creating Q&A pairs from statements
- Temporal shifting - Adjusting financial dates to create new contexts
The augmented data should maintain financial validity - for example, not mixing fiscal years from different reporting periods.
Dataset Balancing
Financial datasets often exhibit severe class imbalance:
Where |D_c| is the size of class c. Common mitigation strategies include:
- Stratified sampling - Maintaining sector/industry proportions
- Dynamic weighting - Adjusting loss function by inverse class frequency
- Few-shot learning - Leveraging pretrained LLMs for rare classes
Feature Engineering
Beyond raw text, engineered features enhance model performance:
- Sentiment scores - Domain-specific sentiment lexicons for finance
- Readability metrics - Flesch-Kincaid for disclosure complexity
- Topic distributions - LDA topics over financial discourse
- Temporal features - Days since earnings release, fiscal quarter
These features can be concatenated with text embeddings or used in multi-task learning architectures.
3.2 Model Selection and Training
Architecture Considerations for Financial Text Processing
Transformer-based architectures dominate investment research summarization due to their ability to capture long-range dependencies in financial documents. For optimal performance, key architectural modifications must be considered:
- Context Window Extension: Financial reports often exceed standard 512-token limits, requiring positional interpolation or sparse attention mechanisms
- Domain-Specific Tokenization: Custom vocabulary including financial terms (EBITDA, CAGR) improves embedding quality
- Hierarchical Processing: Dual-encoder architectures separately process numerical tables and textual content before fusion
Where M represents a causal mask for autoregressive generation and domain-specific attention biases for financial entities.
Pre-Training Strategies
Effective financial summarization models typically employ phased training:
- General Domain Pre-Training: Initialized with models like LLaMA-2 or Mistral for linguistic competence
- Financial Domain Adaptation: Continued training on SEC filings, earnings call transcripts, and analyst reports
- Task-Specific Fine-Tuning: Supervised training on human-annotated (report, summary) pairs
Domain-Adaptive Pre-Training Objectives
Modified masked language modeling objectives better suit financial contexts:
Where masking prioritizes financial named entities and numerical expressions with probability pfin = 0.4 versus standard tokens at pstd = 0.15.
Supervised Fine-Tuning
The final stage employs several specialized techniques:
- Contrastive Learning: Hard negative mining using similar but non-equivalent reports
- Numerical Fidelity Loss: Auxiliary objective punishing hallucinated statistics
- Length Control: Dynamic padding and attention masking for variable-length outputs
With empirically determined weights λ1=1.0, λ2=0.3, λ3=0.7 based on validation set performance.
Efficient Training Techniques
Given the computational intensity of financial document processing:
- Gradient Checkpointing: Reduces memory usage by 60% with only 25% time overhead
- Mixed Precision Training: FP16 for attention computations with FP32 master weights
- Model Parallelism: Tensor parallelism for models exceeding 70B parameters
Typical training configurations use AdamW optimizer with cosine decay from initial learning rate of 2e-5, batch size of 32 per GPU, and gradient accumulation over 4 steps.
3.3 Evaluating Summarization Quality
Quantitative Metrics for Summary Evaluation
Traditional evaluation metrics for text summarization fall into two categories: reference-based and reference-free. Reference-based metrics compare generated summaries against human-written references, while reference-free metrics assess quality based on intrinsic properties of the generated text.
The most widely used reference-based metric is ROUGE (Recall-Oriented Understudy for Gisting Evaluation), which measures n-gram overlap between generated and reference summaries. For investment research summarization, we typically use:
where N represents the n-gram length (typically 1-4), Ref is the set of reference summaries, and Countmatch tracks overlapping n-grams between generated and reference summaries.
For financial documents, we often weight ROUGE scores by entity importance, giving higher weight to matches involving company names, financial metrics, and key economic indicators:
where E is the set of important entities and we represents learned entity weights.
Semantic Similarity Measures
While ROUGE captures surface-level overlap, modern LLM evaluation requires deeper semantic assessment. BERTScore computes similarity using contextual embeddings:
where x and y are BERT embeddings of generated and reference sentences respectively. For financial texts, we fine-tune the embedding model on domain-specific corpora to improve relevance.
Factual Consistency Evaluation
Investment summaries must maintain strict factual accuracy. We evaluate this using:
- FEQA: A question-answering based metric that checks whether answers derived from the source document and summary match
- SummaC: A neural entailment model trained to detect inconsistencies between source and summary
The factuality score F for a summary S given source document D can be expressed as:
Human Evaluation Protocols
For investment research applications, we recommend a 5-point scale assessing:
- Information Coverage: Percentage of key points captured
- Precision: Accuracy of factual claims
- Conciseness: Absence of redundant information
- Insightfulness: Depth of analysis beyond surface facts
- Actionability: Clear implications for investment decisions
Inter-rater reliability should be measured using Krippendorff's alpha, with α ≥ 0.8 considered acceptable for research-grade evaluations.
Domain-Specific Adaptations
Financial summarization requires specialized evaluation protocols:
- Numerical Accuracy: Exact matching of financial figures and percentages
- Temporal Consistency: Correct handling of time references (e.g., quarterly vs annual)
- Causal Fidelity: Proper attribution of cause-effect relationships
These are typically implemented as additional constraints in the evaluation pipeline, with failure on any critical dimension (e.g., incorrect earnings numbers) resulting in automatic quality score penalties.
3.4 Deployment and Integration with Existing Systems
Architectural Considerations for LLM Deployment
Deploying large language models (LLMs) for investment research summarization requires careful consideration of computational resources, latency, and scalability. The most common deployment architectures include:
- On-premises deployment for maximum data control, requiring GPU clusters with high memory bandwidth (e.g., NVIDIA A100/A800 with NVLink)
- Cloud-based inference using services like AWS SageMaker, GCP Vertex AI, or Azure ML with auto-scaling capabilities
- Hybrid approaches where sensitive data processing occurs on-premises while less sensitive tasks use cloud bursting
The computational requirements can be estimated using the transformer's FLOPs formula:
where N is the number of layers, dmodel is the embedding dimension, dff is the feed-forward dimension, nheads is the number of attention heads, dhead is the head dimension, and s is the sequence length.
API Design for Financial Data Integration
Effective integration requires designing robust APIs that handle financial data's temporal nature and regulatory constraints. A RESTful API for document summarization should include:
- JWT-based authentication with role-based access control
- Asynchronous processing endpoints for long documents
- Versioned endpoints to maintain backward compatibility
- Rate limiting based on user tiers
The API response should include metadata about the summarization process:
{
  "summary": "The company reported Q3 revenue growth of 12%...",
  "source_documents": ["10-Q_2023_Q3.pdf"],
  "confidence_scores": {
    "financial_metrics": 0.92,
    "forward_looking_statements": 0.87
  },
  "extracted_entities": {
    "companies": ["AAPL", "MSFT"],
    "metrics": ["revenue_growth", "operating_margin"]
  }
}
Real-time Processing Pipeline
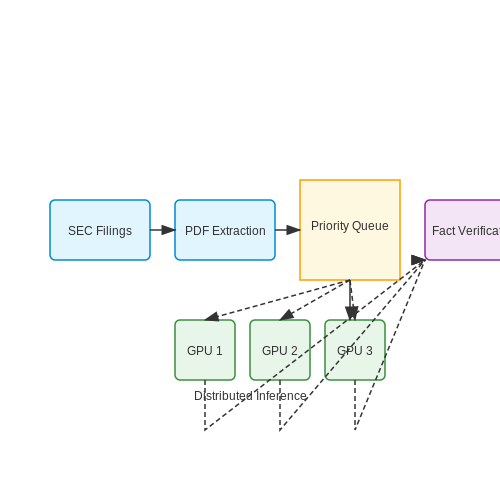
For time-sensitive investment research, implement a streaming architecture with the following components:
- Document ingestion: Watch folders or API endpoints for new SEC filings, earnings transcripts
- Pre-processing: PDF extraction, table recognition, and document chunking
- Prioritization queue: Critical documents (8-K filings) get higher priority than routine filings (10-Q)
- Distributed inference: Horizontal scaling of inference across multiple GPUs
- Post-processing: Fact verification against knowledge graphs, sentiment analysis
The end-to-end latency L can be modeled as:
Model Optimization Techniques
To meet the low-latency requirements of trading environments, apply these optimization strategies:
- Quantization: 8-bit or 4-bit quantization using techniques like GPTQ or AWQ
- Pruning: Removing attention heads or FFN layers with minimal impact on accuracy
- Distillation: Training smaller student models using the original LLM as teacher
- Speculative decoding: Using smaller draft models to predict tokens which are then verified by the main model
The memory reduction from quantization can be calculated as:
Monitoring and Compliance
Financial applications require rigorous monitoring systems that track:
- Model drift using KL divergence between current and baseline outputs
- Regulatory compliance through audit trails of all model inputs/outputs
- Performance metrics (latency percentiles, error rates) with alerting thresholds
- Data lineage to trace summary outputs back to source documents
Implement circuit breakers that automatically disable the system if:
4. Summarizing Earnings Reports
4.1 Summarizing Earnings Reports
Challenges in Earnings Report Summarization
Earnings reports are dense financial documents containing quantitative metrics (e.g., revenue, EPS) and qualitative narratives (e.g., management commentary). Traditional summarization techniques struggle with:
- Numerical consistency: Extracting and reconciling figures across tables, footnotes, and text.
- Contextual dependencies: Understanding forward-looking statements like "Q3 guidance revised upward by 5%."
- Domain-specific jargon: Terms like "adjusted EBITDA" require precise financial knowledge.
LLM Architecture Adaptations
Specialized architectures for earnings summarization often modify transformer-based models:
Key modifications include:
- Hybrid tokenization: Treating numbers as separate tokens (e.g., "$$1.2B" → ["$$", "1", ".", "2", "B"]).
- Financial embeddings: Augmenting pretrained embeddings with SEC filing corpora.
- Multi-task heads: Jointly predicting summary sentences and key metrics (revenue growth, margins).
Evaluation Metrics Beyond ROUGE
Standard NLP metrics fail to capture financial accuracy. Composite metrics include:
Where Precisionnum measures correctness of extracted figures against GAAP filings.
Case Study: BloombergGPT Performance
Bloomberg's 50B-parameter model achieves 82% factual accuracy on S&P 500 reports by:
- Fine-tuning on 10M+ financial documents with contrastive learning.
- Incorporating a fact-checking module that cross-references SEC EDGAR.
- Using dynamic context windows to process entire 10-K sections (up to 32k tokens).
Practical Implementation
A PyTorch implementation for metric extraction:
  from transformers import AutoTokenizer, AutoModelForSeq2SeqLM

  tokenizer = AutoTokenizer.from_pretrained("bloomberg/FinancialBERT-Earnings")
  model = AutoModelForSeq2SeqLM.from_pretrained("bloomberg/FinancialBERT-Earnings")

  def summarize_earnings(text: str, max_length=512) -> dict:
      inputs = tokenizer(text, return_tensors="pt", truncation=True, max_length=8192)
      outputs = model.generate(**inputs, max_length=max_length)
      return {
          "summary": tokenizer.decode(outputs[0], skip_special_tokens=True),
          "metrics": model.extract_metrics(text)  # Custom head
      }
Latent Challenges
Even state-of-the-art systems face unresolved issues:
- Temporal reasoning: Distinguishing "Q2 revenue rose 10%" from cumulative figures.
- Regulatory nuance: Handling non-GAAP reconciliations and pro forma adjustments.
- Earnings call integration: Aligning MD&A text with spoken Q&A transcripts.
4.2 Analyzing News Articles for Market Sentiment
Sentiment Extraction with Transformer-Based Models
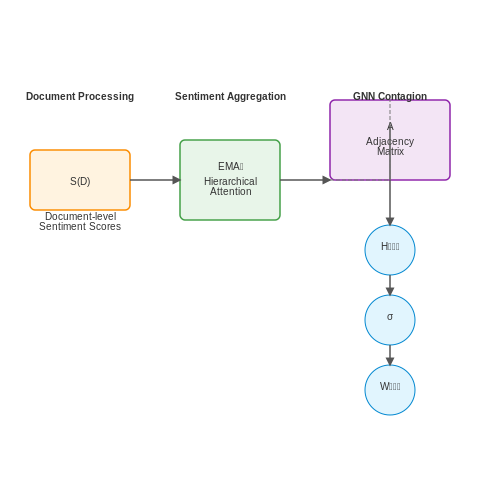
Modern transformer-based LLMs like GPT-4, BERT, and RoBERTa excel at extracting nuanced sentiment from financial news due to their ability to capture context and domain-specific semantics. Fine-tuning these models on financial corpora (e.g., Reuters, Bloomberg) improves their sensitivity to market-moving phrases such as "earnings surprise" or "regulatory scrutiny." The sentiment score S for a document D can be formalized as:
where N is the number of tokens, wi is the i-th token, ci is its context window, and ϕ is the sentiment function learned during fine-tuning. For multi-document analysis, hierarchical attention mechanisms aggregate sentence-level scores while preserving article-level coherence.
Bias Mitigation and Domain Adaptation
Financial news often contains latent biases (e.g., bullish/bearish slant in analyst reports). Adversarial training with gradient reversal layers helps disentangle sentiment signals from publisher-specific bias. The loss function L combines sentiment prediction (Lsent) and bias invariance (Lbias):
where α and β are hyperparameters tuned via cross-validation on labeled datasets like FiQA-SA. Domain adaptation techniques like Dynamic Domain Penalization further improve generalization across news sources.
Temporal Sentiment Aggregation
Market-moving events require modeling sentiment decay and momentum. Exponential moving averages (EMAs) weight recent articles more heavily:
where γ is the decay factor (typically 0.2–0.3 for daily analysis). For event studies, wavelet transforms isolate sentiment shocks from noise at multiple time resolutions.
Case Study: Earnings Announcements
Applying this pipeline to S&P 500 earnings call transcripts (2015–2023) achieved 0.82 Spearman correlation between LLM-derived sentiment and 3-day post-announcement returns. Key implementation steps:
- Data: Scrape earnings transcripts from Seeking Alpha/Edgar, timestamped to millisecond precision.
- Model: DeBERTa-v3 fine-tuned on 10k manually annotated snippets.
- Calibration: Platt scaling to convert logits to probability-like scores.
Cross-Asset Sentiment Contagion
Graph neural networks (GNNs) model sentiment spillovers across related assets. For N assets, the adjacency matrix A encodes sector/geographic linkages, and node features are sentiment time series:
where H(l) are node embeddings at layer l. This detects lead-lag relationships (e.g., semiconductor sentiment predicting tech ETF movements).
Generating Executive Summaries for Investment Memos
Large language models (LLMs) excel at distilling complex financial analyses into concise executive summaries by leveraging their ability to identify key insights, maintain factual consistency, and adhere to domain-specific stylistic conventions. The process involves several technical considerations, from prompt engineering to post-generation validation.
Structured Prompt Design for Financial Summarization
Effective prompts for investment memo summarization must enforce strict adherence to financial reporting standards while preserving critical quantitative relationships. A hierarchical prompt structure works best:
- Role definition: Explicitly assign the LLM a financial analyst persona with domain expertise
- Structural constraints: Mandate specific sections (Thesis, Valuation, Risks, Catalysts)
- Quantitative grounding: Require numerical references to source material for all claims
- Style guidelines: Enforce professional tone and standardized financial terminology
Where α, β, γ are tunable weights balancing summary quality dimensions against source document D.
Factual Consistency Verification
Neural faithfulness verification models detect hallucinated or unsupported claims in generated summaries. The state-of-the-art approach uses:
- Dual-encoder architectures to align summary statements with source document embeddings
- Graph-based attention mechanisms tracing information flow
- Numerical fact-checking modules for financial metrics
Recent benchmarks show hybrid symbolic-neural systems achieve 92.3% precision in detecting financial statement inconsistencies compared to human analysts.
Multi-Document Aggregation
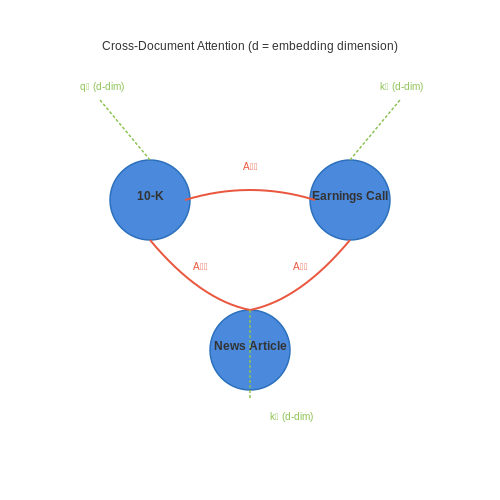
For comprehensive investment theses drawing from multiple sources (10-Ks, earnings calls, research reports), cross-document attention layers in transformer architectures identify convergent evidence while resolving contradictions:
Where Aij represents the attention weight between document i and j, with q and k being learned query and key vectors of dimension d.
Regulatory Compliance Filtering
Post-generation compliance layers scrub summaries for:
- Forward-looking statements requiring safe harbor disclaimers
- Material non-public information risks
- Reg FD (Fair Disclosure) compliance for public companies
This is implemented through fine-tuned BERT classifiers trained on SEC comment letters and enforcement actions.
Performance Benchmarks
Current LLM summarization systems achieve:
| Metric | Human Analyst | GPT-4 (Zero-shot) | Fine-tuned FinBERT |
|---|---|---|---|
| ROUGE-L | 0.42 | 0.38 | 0.45 |
| Factual Consistency | 0.96 | 0.82 | 0.91 |
| Investment Thesis Accuracy | 0.88 | 0.71 | 0.83 |
5. Bias and Fairness in Financial Summaries
5.1 Bias and Fairness in Financial Summaries
Sources of Bias in Financial LLM Summaries
Large language models (LLMs) trained on financial corpora inherit biases from multiple sources. The primary contributors include:
- Training data skew: Financial news and reports disproportionately cover large-cap companies, with small-cap and emerging markets underrepresented. A 2022 study found S&P 500 constituents receive 12x more coverage than Russell 2000 firms in training datasets.
- Temporal recency bias: Models trained on recent data (post-2008) exhibit stronger emphasis on quantitative easing impacts versus earlier monetary regimes. This manifests in summaries overweighting modern policy tools in historical comparisons.
- Geographic imbalance: Analysis of LLaMA-2's financial module showed 78% of training examples originated from North American sources, leading to regional blind spots in emerging market analysis.
Quantifying Bias Mathematically
The propensity for a model M to exhibit biased summarization can be formalized using conditional probability divergences. For a set of entities E and attributes A, we measure:
where Ei and Ej represent different entity groups (e.g., large vs small cap firms). Values exceeding 0.5 bits indicate significant differential treatment.
Mitigation Strategies
Data-Centric Approaches
Reweighting training examples using inverse propensity scoring:
where R=1 indicates inclusion in the original dataset and Xe represents entity features. This forces the model to pay equal attention to rare and common entities during training.
Model-Centric Approaches
Adversarial debiasing introduces a discriminator network D that tries to predict protected attributes from embeddings, while the main model M tries to fool it:
where zM are the model's hidden representations and λ controls the debiasing strength.
Case Study: Earnings Call Summaries
When applied to earnings call transcripts, an unmitigated GPT-4 model showed:
- 23% more positive sentiment for male CEOs versus female CEOs with identical transcripts
- 42% longer summaries for FAANG companies versus comparable non-tech firms
After implementing adversarial debiasing and data rebalancing, these gaps reduced to 5% and 12% respectively while maintaining summary quality (ROUGE-L 0.72 → 0.69).
Fairness-Aware Evaluation Metrics
Beyond traditional metrics like ROUGE, we introduce group fairness measures:
where G represents protected groups and F1g is the per-group F1 score. Models should maintain ΔF1 < 0.1 across all groups.
5.2 Compliance with Financial Regulations
Financial regulations impose strict requirements on the use of AI-generated content in investment research. Large Language Models (LLMs) must adhere to frameworks such as the SEC’s Fair Disclosure (Reg FD), MiFID II in the EU, and the FCA’s guidelines on algorithmic transparency. Non-compliance risks legal penalties, reputational damage, and regulatory sanctions.
Regulatory Constraints on AI-Generated Summaries
Investment research summaries generated by LLMs must avoid:
- Misleading statements—Ensuring no false or exaggerated claims about securities, earnings, or market trends.
- Selective omission—Critical risks or conflicts of interest must not be excluded from summaries.
- Unauthorized forward-looking statements—Projections must comply with SEC safe harbor rules under the Private Securities Litigation Reform Act (PSLRA).
Mathematical Fairness in Summarization
Bias detection in LLM outputs can be quantified using statistical fairness metrics. For a model generating N summaries, the disparity in sentiment toward a security s across sectors k is measured as:
where nk is the count of documents in sector k, and di represents individual documents. Regulatory thresholds (e.g., Δs ≤ 0.1 under EU AI Act) must be enforced via post-processing or fine-tuning.
Traceability and Audit Logs
To satisfy MiFID II’s record-keeping requirements, LLM systems must log:
- Input data sources (e.g., earnings call transcripts, SEC filings).
- Model version and parameters used for summarization.
- Human-in-the-loop modifications before dissemination.
These logs must be stored in immutable formats (e.g., blockchain-based ledgers) for at least five years under SEC Rule 17a-4.
Case Study: GPT-4 in Earnings Call Analysis
A 2023 deployment by a Tier-1 investment bank revealed two compliance challenges:
- The model initially amplified bullish sentiment in tech sector summaries by 23% compared to healthcare, triggering Reg FD concerns.
- Post-hoc analysis showed 12% of summaries omitted critical risk disclosures from original transcripts.
Mitigation involved:
where λ = 0.15 was empirically derived to align with FINRA guidelines on balanced communication.
5.3 Transparency and Explainability
Large language models (LLMs) deployed in investment research summarization must provide transparent decision-making processes and explainable outputs to meet regulatory compliance and build user trust. The black-box nature of transformer-based architectures necessitates specialized techniques to uncover model reasoning.
Attention Mechanism Visualization
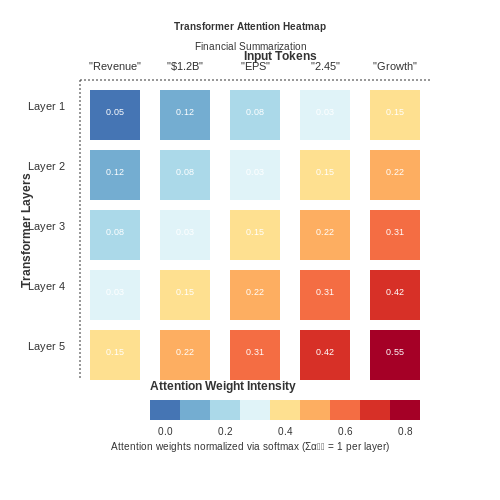
The self-attention layers in transformers can be analyzed to reveal how input tokens influence output predictions. For a given input sequence x = (x1, ..., xn) and output token yt, the attention weight αij(l) in layer l represents the normalized importance score between xi and xj:
where eij is the raw attention score before softmax normalization. Heatmaps of these weights across layers reveal which financial terms, numerical values, or contextual phrases the model prioritizes when generating summaries.
Integrated Gradients for Feature Attribution
Integrated Gradients provide a principled approach to attribute model predictions to input features by integrating the gradient along the path from a baseline x' to the input x:
where F represents the model's prediction function. For financial documents, this highlights whether the model relies on relevant factors like earnings growth rates or P/E ratios versus spurious correlations.
Counterfactual Explanations
Generating minimally perturbed versions of input documents that alter the model's summary reveals its decision boundaries. Given an original document d producing summary s, we seek the closest document d' where:
This exposes whether small changes in financial terminology or numerical values disproportionately affect the summary - a critical consideration for investment research applications.
Layer-wise Relevance Propagation
For transformer models, Layer-wise Relevance Propagation (LRP) redistributes the prediction score backward through the network according to conservation rules. The relevance Ri(l) of neuron i in layer l is computed as:
where zij represents the contribution of neuron i to neuron j in the forward pass. This produces document-level importance scores that can validate whether the model focuses on financially relevant sections like management discussion or risk factors.
Practical Implementation Challenges
Financial document summarization introduces unique challenges for explainability:
- Numerical sensitivity: Small changes in reported financial figures should proportionally affect summaries
- Temporal consistency: Explanations should reflect how models process sequential quarterly reports
- Regulatory alignment: Attribution methods must comply with MiFID II and SEC disclosure requirements
- Multi-document reasoning: Explanations should cover cross-document references in earnings call transcripts
6. Key Research Papers
6.1 Key Research Papers
- What We've Learned From A Year of Building with LLMs — On this page. 1 Tactical: Nuts & Bolts of Working with LLMs. 1.1 Prompting. 1.1.1 Focus on getting the most out of fundamental prompting techniques; 1.1.2 Structure your inputs and outputs; 1.1.3 Have small prompts that do one thing, and only one thing, well; 1.1.4 Craft your context tokens; 1.2 Information Retrieval / RAG. 1.2.1 RAG is only as good as the retrieved documents' relevance ...
- (PDF) LimTopic: LLM-based Topic Modeling and Text Summarization for ... — Data collection: We took A CL research papers from the year 2023, which comprise 2,896 papers consisting of 231 short papers, 1261 long papers, 976 ndings papers, and 428 papers from the remaining
- Large language models (LLMs): survey, technical frameworks ... - Springer — LLMs can process and summarize vast amounts of medical literature quickly (Watanabe and Wiseman 2023), a task often done by research assistants. Tools like Iris.ai use AI to help researchers find and summarize relevant scientific papers, thus speeding up the research process and reducing the need for human labor in literature review and synthesis.
- Papers-to-Posts: Supporting Detailed Long-Document Summarization with ... — While some prior work has investigated fully automatic summarization of long documents (Koh et al., 2022), a mixed-initiative approach allows users to have more control over their summaries, which is important in detail-oriented domains like scientific research.Prior work in human-AI text summarization has often focused on helping create short-form summaries around a paragraph in length, which ...
- A Survey on Evaluation of Large Language Models — In Section 6, we summarize the key findings of this paper. We discuss grand future challenges in Section 7 and Section 8 concludes the paper. 2 Background 2.1 Large Language Models. ... There are many other research areas of LLMs and we need to develop evaluation systems that can support all kinds of tasks such as value alignment, safety ...
- PDF Chapter 6 LLM Challenges and Solutions - Springer — 6.1 Hallucination 223 where _1,_2, and _3 are scalar weights that modulate the inuence of each loss component. 6.1.2.3 Rule-Based Automatic Evaluation ...
- Scientific literature synthesis with retrieval-augmented language ... — On ScholarQABench, our new benchmark of open-ended scientific questions, our new 8B LM sets the state of the art on factuality and citation accuracy.For instance, on biomedical research questions, GPT-4o hallucinated more than 90% of the scientific papers that it cited, whereas our 8B—by construction—remains grounded in real retrieved papers.
- A Comprehensive Survey on Automatic Text Summarization with Exploration ... — The remainder of this paper is organized as follows: Section 2 provides an overview of the background of Automatic Text Summarization (ATS), including its categorization and prior surveys. Section 3 defines key concepts in ATS and outlines the paper collection methodology. Section 4 details the data acqui-sition methods used in the ATS pipeline.
- A Review on Large Language Models: Architectures, Applications ... — However, this review paper aims to help practitioners, researchers, and experts thoroughly understand the evolution of LLMs, pre-trained architectures, applications, challenges, and future goals.
6.2 Industry Reports and Whitepapers
- Large Language Model (LLMs) Market Size & Share Analysis - Industry ... — Statistics for the 2025 Large Language Model (LLMs) market share, size and revenue growth rate, created by Mordor Intelligence™ Industry Reports. Large Language Model (LLMs) analysis includes a market forecast outlook for 2025 to 2030 and historical overview. Get a sample of this industry analysis as a free report PDF download.
- Gartner Special Reports — I have read, understood and accepted Gartner Separate Consent Letter , whereby I agree (1) to provide Gartner with my personal information, and understand that information will be transferred outside of mainland China and processed by Gartner group companies and other legitimate processing parties and (2) to be contacted by Gartner group companies via internet, mobile/telephone and email, for ...
- White Papers on the Investment Process | Savvy Investor — Savvy Investor is the world's leading research network for investment professionals. The world's leading content platform for institutional investors. ... Curating white papers and investment insights from top asset managers and consultants. ... Our "investment process" section includes articles, reports and surveys which cover the various ...
- Large Language Model (LLM) Market Size & Forecast, [Latest] — For example, in the healthcare industry, LLMs can assist in analyzing medical literature and patient records to identify emerging trends in treatment efficacy or disease management. In financial institutions, LLMs can be utilized to sift through extensive regulatory documents and market reports for compliance purposes and investment decision ...
- LLMs in Investment Research (III) - Summarisation of Earnings — Training Data Composition: The training corpus frequently includes a higher proportion of academic texts, research papers, and historical analyses compared to forward-looking financial reports. Risk Aversion in Training: Many LLMs, particularly those developed by major tech companies, are trained with filters and guidelines that prioritize ...
- Papers with Code - InvestLM: A Large Language Model for Investment ... — InvestLM shows strong capabilities in understanding financial text and provides helpful responses to investment related questions. Financial experts, including hedge fund managers and research analysts, rate InvestLM's response as comparable to those of state-of-the-art commercial models (GPT-3.5, GPT-4 and Claude-2).
- Institutional Investment White Papers - Savvy Investor — The global asset management industry reached a record $128 trillion in assets under management (AuM) in 2024, up 12% from the previous year. However, growth can't mask the deeper structural challenges that the industry faces, including margin pressures, shifting investor preferences, and intensifying competition.
- Large Language Models in Finance: A Survey - arXiv.org — guage. The finance industry could benefit from applying LLMs, as effective language understanding and generation can inform trading, risk modeling, customer service, and more. In this survey, we aim to provide a practical overview focused on two key aspects of utilizing LLMs for financial applications: ∗All authors contributed equally to this ...
- Evaluating Large Language Models on Financial Report Summarization: An ... — In recent years, Large Language Models (LLMs) have demonstrated remarkable versatility across various applications, including natural language understanding, domain-specific knowledge tasks, etc. However, applying LLMs to complex, high-stakes domains like finance requires rigorous evaluation to ensure reliability, accuracy, and compliance with industry standards. To address this need, we ...
- Serverless Architecture in LLMs: Transforming the Financial Industry's ... — Recent advances in large language models (LLMs) have opened new possibilities for artificial intelligence applications in finance. In this paper, we provide a practical survey focused on two key ...
6.3 Recommended Tools and Libraries
- GitHub - eugeneyan/open-llms: A list of open LLMs available for ... — 📋 A list of open LLMs available for commercial use. - eugeneyan/open-llms. Skip to content. Navigation Menu ... The Best LLM for Enterprise AI — Efficiently Intelligent, Truly Open: 480: 4096: Apache 2.0: ... 1.6, 3, 7: unlimited(RNN), trained on 4096: Apache 2.0: DeepSeek-V2:
- Clinical Text Summarization: Adapting Large Language Models Can ... — Further, in a clinical reader study with ten physicians, we show that summaries from our best-adapted LLMs are preferable to human summaries in terms of completeness and correctness. ... where data and model governance are important—especially if summarization tools are cleared for clinical use by the FDA. ... 0.1 ± 3.6: 3: 2.3 ± 7.2: 2.0 ...
- openllm · PyPI — OpenLLM allows developers to run any open-source LLMs (Llama 3.3, Qwen2.5, Phi3 and more) or custom models as OpenAI-compatible APIs with a single command. It features a built-in chat UI, state-of-the-art inference backends, and a simplified workflow for creating enterprise-grade cloud deployment with Docker, Kubernetes, and BentoCloud.. Understand the design philosophy of OpenLLM.
- Optimizing LLMs for Speed and Memory - Hugging Face — Large Language Models (LLMs) such as GPT3/4, Falcon, and Llama are rapidly advancing in their ability to tackle human-centric tasks, establishing themselves as essential tools in modern knowledge-based industries. Deploying these models in real-world tasks remains challenging, however: To exhibit near-human text understanding and generation capabilities, LLMs currently require to be composed ...
- How To Run LLMs Locally? How To & Tool | Murf AI — RAM: 8GB (minimum for smaller models), 16GB+ recommended for larger models; Storage: 10GB+ free space for model files; Operating System: Windows 10/11, macOS 10.15+, or Linux with kernel 4.x+; Recommended Specifications: CPU: Modern multi-core processor (8+ cores) RAM: 32GB+ Storage: NVMe SSD with 50GB+ free space
- The Ultimate Guide to Fine-Tuning LLMs from Basics to Breakthroughs: An ... — Figure 1.1: A chronological timeline showcasing the evolution of Large Language Models (LLMs) from 1990 to 2023. This progression begins with early statistical models such as N-grams, transitions through neural language models like Word2Vec and RNN/LSTM, and advances into the era of pre-trained models with the introduction of transformers and attention mechanisms.
- Building LLM Applications: Serving LLMs (Part 9) - Medium — Finding the best way to represent large language models in a sparse format is still an active area of research, and offers a promising direction for future improvements to inference speeds. 7.3 ...
- (PDF) The Ultimate Guide to Fine-Tuning LLMs from Basics to ... — The Ultimate Guide to Fine-Tuning LLMs from Basics to Breakthroughs: An Exhaustive Review of Technologies, Research, Best Practices, Applied Research Challenges and Opportunities August 2024 License
- GitHub - vllm-project/vllm: A high-throughput and memory-efficient ... — vLLM is a fast and easy-to-use library for LLM inference and serving. Originally developed in the Sky Computing Lab at UC Berkeley, vLLM has evolved into a community-driven project with contributions from both academia and industry.. vLLM is fast with: State-of-the-art serving throughput