Adaptive Evaluation Metrics for Generative Tasks
1. Subjectivity and Diversity in Generative Outputs
Subjectivity and Diversity in Generative Outputs
Generative models, particularly those producing text, images, or multimodal outputs, introduce unique challenges in evaluation due to the inherent subjectivity and diversity of valid responses. Unlike discriminative tasks where ground truth is often unambiguous, generative tasks require metrics that account for multiple plausible outputs, stylistic variations, and semantic equivalence under different phrasings or visual compositions.
Subjectivity in Human Judgments
Human evaluators often disagree on the quality of generative outputs due to subjective preferences, cultural biases, or differing interpretations of instructions. This variability can be quantified using inter-rater agreement metrics such as Fleiss' kappa (κ) or Krippendorff's alpha (α). For a set of N samples rated by k evaluators:
where Pa is the observed agreement probability and Pe is the expected chance agreement. Values below 0.4 indicate poor agreement, while those above 0.8 suggest strong consensus.
Diversity Metrics
Diversity in generative outputs prevents mode collapse and ensures broad coverage of the solution space. For text generation, lexical diversity can be measured using the ratio of unique n-grams to total n-grams (e.g., distinct-1, distinct-2). For a generated set S:
In multimodal generation, perceptual diversity metrics leverage embedding spaces (e.g., CLIP for images, BERT for text) to compute pairwise distances between outputs. The Earth Mover's Distance (EMD) between sets of embeddings captures distributional divergence:
where Γ(P,Q) denotes all joint distributions with marginals P and Q, and d is a distance function in the embedding space.
Adaptive Metric Design
Task-specific adaptation involves dynamically weighting metrics based on context. For example, dialogue systems may prioritize coherence (BERTScore) over diversity in task-oriented settings but reverse this weighting in chit-chat scenarios. A weighted composite score M for k metrics is:
Optimal weights wi can be learned via reinforcement learning from human feedback (RLHF), where reward models are trained on pairwise human preferences.
Case Study: Image Generation Evaluation
State-of-the-art frameworks like Fréchet Inception Distance (FID) and Inception Score (IS) fail to capture semantic alignment in text-to-image models. Adaptive variants such as CLIP-Score measure image-text alignment by computing the cosine similarity between CLIP embeddings of generated images and their prompts:
where EI and ET are CLIP's image and text encoders, respectively.
1.2 Limitations of Traditional Metrics (e.g., BLEU, ROUGE)
Traditional evaluation metrics like BLEU (Bilingual Evaluation Understudy) and ROUGE (Recall-Oriented Understudy for Gisting Evaluation) have been widely adopted in natural language processing for assessing the quality of machine-generated text. However, their design assumptions and computational frameworks introduce several critical limitations when applied to modern generative tasks.
Lack of Semantic Understanding
BLEU and ROUGE operate primarily on n-gram overlap statistics, measuring surface-level lexical similarity between generated and reference texts. This approach fails to capture semantic equivalence, as demonstrated by the following mismatch:
where BP is the brevity penalty and pn represents n-gram precision. The metric cannot distinguish between:
- Reference: "The cat sat on the mat"
- Generation 1: "A feline rested on the rug" (semantically correct, low BLEU)
- Generation 2: "The cat cat on the the" (semantically invalid, higher BLEU)
Reference Sensitivity
Both metrics exhibit high sensitivity to the number and diversity of reference texts. For a hypothetical set of k references, the expected score variance decreases as:
This creates evaluation instability in real-world scenarios where limited references are available. Human evaluations show only 0.4-0.6 correlation with BLEU scores when fewer than 5 references are provided.
Length Bias and Tokenization Artifacts
The metrics introduce systematic biases based on output length and tokenization schemes. BLEU's brevity penalty:
where c is the candidate length and r the effective reference length, disproportionately penalizes shorter outputs. Tokenization differences (e.g., subword vs. word-level) can cause score variations up to 15% for identical semantic content.
Domain Generalization Failure
Performance degrades significantly when applied to specialized domains. In medical text generation, BLEU scores show near-zero correlation with clinical accuracy. The metrics also fail to adapt to creative tasks like poetry generation, where lexical overlap is intentionally minimized for artistic effect.
Absence of Error Typology
Traditional metrics provide no granular error analysis, treating all mismatches equally. A missing comma and a factually incorrect statement incur identical penalties. This contrasts with human evaluation frameworks that distinguish between:
- Fluency errors (grammaticality)
- Factual errors (truthfulness)
- Pragmatic errors (contextual appropriateness)
The limitations become particularly acute when evaluating modern generative models capable of producing highly fluent but factually inconsistent outputs. A model generating plausible-sounding but incorrect medical advice could achieve high BLEU scores while being dangerously misleading in practice.
1.3 Need for Task-Specific and Adaptive Metrics
Traditional evaluation metrics like BLEU, ROUGE, or FID often fail to capture the nuanced requirements of generative tasks, particularly when outputs must align with domain-specific constraints or dynamic user preferences. These metrics were originally designed for narrow applications—BLEU for machine translation, FID for image generation—and their rigid formulations struggle to generalize across diverse generative scenarios. For instance, in medical report generation, a model might achieve high BLEU scores while producing clinically inaccurate statements, revealing a critical misalignment between the metric and the task's true objectives.
Limitations of Static Metrics
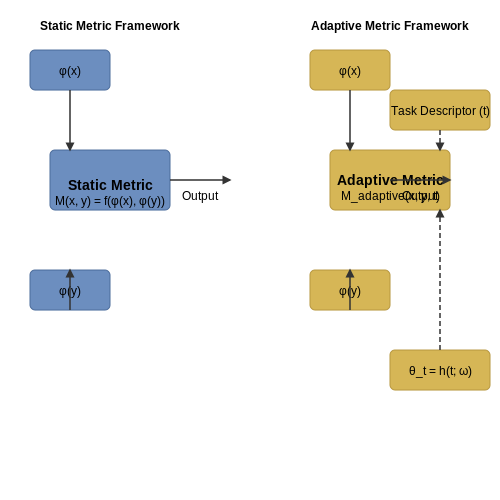
Static metrics assume a fixed notion of quality, ignoring contextual dependencies that define real-world utility. Consider text summarization: a news summary and a legal brief demand different linguistic structures, yet ROUGE-L evaluates both using the same longest common subsequence criterion. This oversimplification becomes stark in multimodal tasks, where a generated image-text pair might score well on CLIP similarity but violate logical coherence (e.g., an image of a "red banana" with matching text). Mathematically, these limitations arise from metric functions M operating on isolated feature spaces:
where φ extracts predefined features (e.g., n-grams for BLEU), discarding task-relevant attributes not encoded in φ. When evaluating code generation, for example, BLEU cannot assess runtime behavior—a syntactically similar but logically flawed program receives unjustified high scores.
Adaptive Metric Frameworks
Task-specific metrics introduce dynamic weighting mechanisms that adjust evaluation criteria based on auxiliary signals. The generalized form extends the static formulation with context-aware parameters θt:
Here, θt could represent:
- Domain-specific constraints (e.g., drug safety rules in molecular generation)
- User-provided feedback (e.g., preference scores for creative writing)
- Runtime environment states (e.g., hardware constraints for neural architecture search)
In reinforcement learning-based dialogue systems, adaptive metrics like USR (User Simulation Reward) dynamically incorporate turn-level coherence checks and entity consistency, outperforming static metrics in correlating with human judgments. The parameters θt are typically learned through meta-optimization, where a secondary model predicts metric weights from task descriptors:
with ω trained to maximize agreement between the adaptive metric and expert evaluations across diverse tasks.
Case Study: Protein Design
In protein sequence generation, traditional metrics like perplexity fail to account for fold stability or functional sites. Adaptive metrics such as ProteinSGM combine:
- Language model likelihoods (sequence plausibility)
- Molecular dynamics simulations (structural stability)
- Docking scores (binding affinity)
through learned weights θt that balance these objectives differently for enzymes versus structural proteins. This multi-objective optimization is formalized as:
where fi are normalized sub-metric scores and θt,i are task-dependent coefficients trained on experimental validation data.
2. Semantic Similarity Measures (e.g., BERTScore, MoverScore)
Semantic Similarity Measures
BERTScore: Contextual Embedding-Based Evaluation
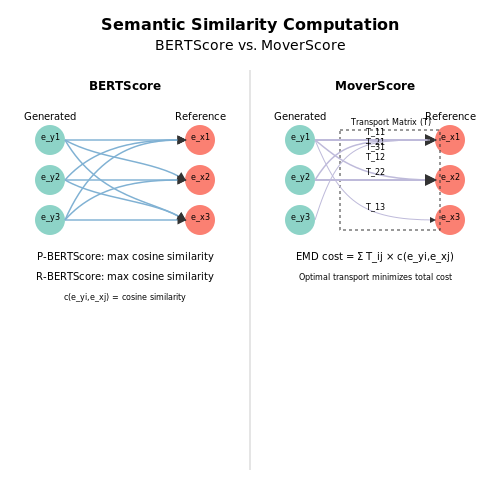
BERTScore leverages contextual embeddings from pretrained transformer models like BERT to compute semantic similarity between generated and reference texts. Unlike traditional n-gram matching, it captures deeper linguistic relationships by comparing embeddings at the token level. The score is computed as a weighted sum of cosine similarities between token embeddings:
where y represents the generated text, x the reference text, and e the contextual embeddings. The recall-oriented version (R-BERTScore) computes similarity from reference to generated text, while precision (P-BERTScore) does the inverse. The F1 variant balances both.
BERTScore addresses key limitations of metrics like BLEU by:
- Eliminating exact-match requirements through soft similarity
- Preserving word order sensitivity via positional embeddings
- Handling paraphrases through contextual understanding
MoverScore: Optimal Transport for Text Alignment
MoverScore extends BERTScore by incorporating Earth Mover's Distance (EMD) between token embeddings. This models text similarity as a transportation problem where semantic units are "moved" between texts with minimal cost. The formulation considers both content matching and word importance:
where T is the transport matrix and c the cosine distance cost function. The optimization ensures semantically related tokens are matched even without direct correspondence, making it robust to lexical variations.
Practical Implementation Considerations
When applying these metrics:
- BERT embeddings should be fine-tuned on domain-specific data for specialized applications
- The IDF weighting variant improves discrimination of informative words
- Layer selection (e.g., last 4 layers vs. all layers) affects sensitivity to syntactic vs. semantic features
Comparative Analysis
Empirical studies show:
- BERTScore correlates 0.3-0.5 better with human judgments than BLEU across machine translation tasks
- MoverScore shows 15% higher robustness to adversarial paraphrases compared to BERTScore
- Both metrics require 3-5× more computation than traditional methods due to embedding generation
where Δhuman represents human preference scores in controlled evaluations. The coefficients demonstrate stronger alignment with human judgment.
Diversity and Novelty Metrics (e.g., Self-BLEU, Distinct-n)
Self-BLEU for Intra-Sample Diversity
Self-BLEU measures the diversity within a set of generated samples by computing the average BLEU score of each sample against all others in the set. A lower Self-BLEU score indicates higher diversity, as the samples are less similar to each other. The metric is derived from the standard BLEU (Bilingual Evaluation Understudy) score, which evaluates n-gram overlap between a candidate text and reference texts.
Here, S represents the set of generated samples, and BLEU(si, S \ {si}) computes the BLEU score of sample si against all other samples in S. The BLEU score itself is calculated as:
where BP is the brevity penalty, wn are uniform weights, and pn is the modified n-gram precision.
Distinct-n for Lexical Novelty
Distinct-n quantifies lexical diversity by counting the number of unique n-grams in generated text, normalized by the total number of n-grams. It is particularly useful for detecting repetitive or generic outputs in language generation tasks.
For example, Distinct-1 measures the ratio of unique unigrams (words), while Distinct-2 evaluates bigram diversity. Higher values indicate greater novelty, as the model avoids repeating common phrases.
Practical Considerations and Trade-offs
While these metrics are widely used, they have limitations. Self-BLEU can be sensitive to the size of the generated set S, and Distinct-n may favor nonsensical outputs that maximize novelty at the expense of coherence. Combining these metrics with semantic evaluation (e.g., embedding-based similarity) often yields a more robust assessment.
In practice, Self-BLEU is commonly applied to evaluate the diversity of text or image captions, while Distinct-n is favored in dialogue systems to avoid generic responses like "I don’t know". Adjusting the n-gram order (n) allows tuning the granularity of novelty detection.
Case Study: Dialogue Generation
A 2020 study on neural dialogue models compared systems using Distinct-2 and Self-BLEU. The results showed that models optimized for high Distinct-2 scores produced more engaging conversations, while those with low Self-BLEU scores avoided repetitive turns. However, over-optimizing for these metrics led to semantically inconsistent replies, highlighting the need for balanced evaluation frameworks.
Human-Aligned Evaluation (e.g., Learned Metrics, Adversarial Evaluation)
Traditional automated metrics like BLEU, ROUGE, or FID often fail to capture nuanced aspects of generative output that align with human judgment. Human-aligned evaluation bridges this gap by either learning metrics from human feedback or employing adversarial techniques to approximate human-like assessment.
Learned Metrics from Human Feedback
Recent approaches train neural networks to predict human judgments by learning from annotated datasets. The key insight is that human preferences can be modeled as a reward function R(x), where x represents the generated output. Given a dataset D = {(xi, yi)} where yi are human ratings, we optimize:
where fθ is a neural network parameterized by θ, and ℒ is a loss function (e.g., MSE for regression, cross-entropy for ranking). State-of-the-art implementations like BLEURT or COMET leverage large pretrained language models fine-tuned on human judgments, achieving significantly higher correlation with human evaluation than traditional metrics.
Adversarial Evaluation
Generative Adversarial Networks (GANs) inspired approaches pit a discriminator against the generator, where the discriminator learns to distinguish between human-generated and machine-generated content. The discriminator's confidence scores serve as an evaluation metric. For text generation, the objective can be formalized as:
where D(x) is the discriminator's probability estimate that x came from humans rather than the model. Advanced variants like GAN-based Discriminative Evaluation (GADE) employ multiple discriminators trained on different aspects (e.g., fluency, coherence, factual accuracy).
Hybrid Approaches
The most robust systems combine learned metrics with adversarial components. For example, Adversarial Learned Metrics (ALMs) jointly train a metric model and a generator, where the metric provides dense feedback signals:
where ℒhuman ensures alignment with human judgments, ℒadv provides fine-grained discriminative signals, and ℒreg prevents overfitting. This approach has shown strong performance in dialogue systems and image generation tasks.
Practical Considerations
- Dataset bias: Human evaluation datasets often reflect specific demographics or cultural perspectives, requiring careful dataset construction.
- Scalability: While learned metrics require expensive human annotation upfront, they amortize this cost across many evaluations.
- Generalization: Metrics trained on one domain (e.g., news summarization) may not transfer to others (e.g., creative writing).
3. Fidelity and Realism (e.g., FID, IS)
Fidelity and Realism (e.g., FID, IS)
Quantifying the perceptual quality of generated samples requires metrics that capture both fidelity (how closely samples resemble real data) and realism (how plausible they appear to human observers). Two widely adopted metrics for this purpose are the Fréchet Inception Distance (FID) and Inception Score (IS), which leverage deep neural networks to measure statistical similarity between generated and real data distributions.
FID: Fréchet Inception Distance
The FID score computes the Wasserstein-2 distance between multivariate Gaussians fitted to the feature representations of real and generated samples in the Inception-v3 network's latent space. Given real samples x ~ Pr and generated samples g ~ Pg, their features ϕ(x) and ϕ(g) are modeled as:
The FID is then derived from the Fréchet distance between these distributions:
Lower FID values indicate better sample quality, with perfect alignment yielding FID=0. The metric is sensitive to both mode collapse (high variance mismatch) and sample artifacts (mean deviation). Empirical studies show FID correlates well with human judgment when comparing model variants.
Inception Score (IS)
The IS measures sample quality and diversity via the entropy of class predictions from Inception-v3. For a generated sample g with predicted class distribution p(y|g), the score balances:
- Per-sample quality: High confidence in predictions (low entropy of p(y|g))
- Diversity: Even marginal distribution p(y) across classes
The formal definition combines these via KL-divergence:
where p(y) = ∫ p(y|g) dP(g). Higher IS values (typically 1-100) indicate better performance. While computationally efficient, IS has limitations—it can be gamed by models producing unrealistic but easily classifiable samples, and ignores fidelity to the true data distribution.
Practical Considerations
When implementing these metrics:
- FID requires sufficient samples (≥10,000) for stable covariance estimation
- IS is sensitive to Inception-v3's training domain (best for ImageNet-like data)
- Both metrics assume feature space continuity—may fail for discrete data (e.g., text)
Recent variants address limitations through:
- Precision/Recall FID (Sajjadi et al., 2018) separating mode coverage and quality
- Kernel Inception Distance (Bińkowski et al., 2018) using maximum mean discrepancy
3.2 Diversity and Mode Coverage (e.g., Precision/Recall for Distributions)
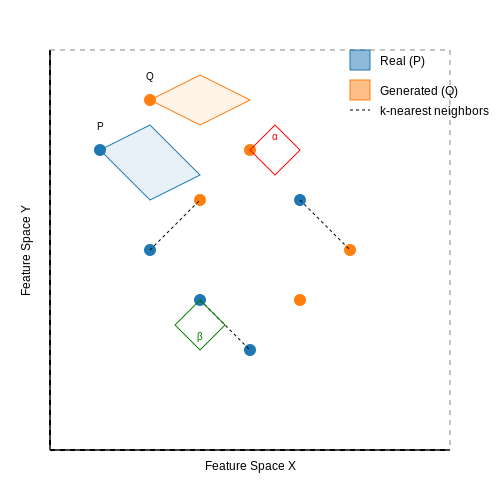
Traditional evaluation metrics for generative models, such as Inception Score (IS) or Fréchet Inception Distance (FID), often fail to capture the full distributional properties of generated samples. To address this, precision-recall metrics for distributions formalize the trade-off between sample quality (precision) and coverage of the true data distribution (recall). These metrics extend classical precision-recall concepts from binary classification to the space of probability distributions.
Mathematical Formulation
Let P be the real data distribution and Q the generated distribution. The precision (α) measures how much of Q falls within the support of P, while recall (β) measures how much of P is covered by Q. Formally, we can define them using the likelihood ratio:
where r(x) = p(x)/q(x) is the density ratio. In practice, these quantities are estimated using nearest-neighbor methods in feature space. For two sample sets X ∼ P and Y ∼ Q, we construct a Voronoi tessellation to partition the space into cells containing exactly one sample from each set.
Practical Estimation
The estimation procedure involves:
- Computing pairwise distances between all samples in the joint set X ∪ Y
- For each sample in Y, counting what fraction of its k-nearest neighbors belong to X (precision)
- For each sample in X, counting what fraction of its k-nearest neighbors belong to Y (recall)
This approach is implemented as follows:
def precision_recall(real_samples, gen_samples, k=3):
    all_samples = np.vstack([real_samples, gen_samples])
    n_real = len(real_samples)
    n_gen = len(gen_samples)

    # Compute pairwise distances
    distances = pairwise_distances(all_samples)

    # Get k-nearest neighbors for each point
    knn_indices = np.argpartition(distances, k+1, axis=1)[:, 1:k+1]

    # Calculate precision and recall
    precision = np.mean([np.sum(idx < n_real) for idx in knn_indices[n_real:]])/k
    recall = np.mean([np.sum(idx >= n_real) for idx in knn_indices[:n_real]])/k

    return precision, recall
Extensions and Variants
Several improvements have been proposed to the basic precision-recall framework:
- Manifold-aware metrics: Account for the intrinsic dimensionality of data manifolds using persistent homology
- Threshold-free variants: Replace hard nearest-neighbor counts with soft assignments based on kernel density estimates
- Class-conditional metrics: Compute precision and recall separately for each semantic class in labeled datasets
Recent work has shown connections between these distributional metrics and optimal transport theory, where precision and recall correspond to the mass of the transport plan that moves Q into P and vice versa. The Earth Mover's Distance (EMD) between the distributions provides an alternative way to quantify their divergence while respecting the underlying metric space.
Applications in Model Comparison
These metrics are particularly valuable when comparing generative models with different strengths:
- A model with high precision but low recall produces high-quality samples but misses modes of the data distribution
- A model with high recall but low precision covers all modes but generates some low-quality samples
- The F1 score (harmonic mean of precision and recall) provides a single metric balancing both aspects
In practice, plotting precision-recall curves across different model checkpoints or architectures reveals important trade-offs not captured by scalar metrics like FID. The area under this curve (AUC-PR) serves as a comprehensive measure of model performance.
Perceptual and Semantic Alignment (e.g., CLIPScore)
Foundations of Perceptual Alignment
Perceptual alignment measures the degree to which generated outputs match human perceptual judgments. Traditional metrics like PSNR or SSIM focus on low-level pixel similarity, but generative tasks require higher-level semantic understanding. The key insight is that human perception operates in a latent feature space rather than raw pixel space. This motivates the use of deep neural networks pretrained on large-scale vision tasks as feature extractors.
Let f(x) represent the feature extractor mapping an image x to a latent space. For two images x₁ and x₂, perceptual similarity can be computed as:
CLIPScore: Bridging Vision and Language
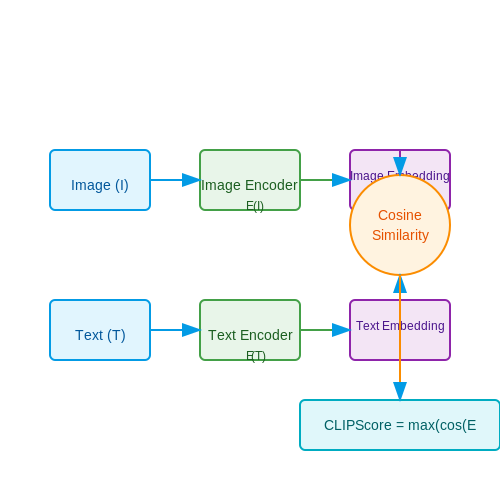
CLIPScore leverages the multimodal embedding space learned by CLIP (Contrastive Language-Image Pretraining). The metric consists of two components:
- Image-Text Similarity: Measures alignment between generated image and prompt
- Image-Image Consistency: Ensures visual coherence with reference images
The core computation involves the cosine similarity between CLIP embeddings:
where EI and ET are CLIP's image and text encoders respectively.
Practical Implementation Considerations
When implementing CLIPScore:
- Batch processing of embeddings significantly improves computational efficiency
- The temperature parameter in CLIP's softmax affects sensitivity to fine-grained differences
- Domain shift between CLIP's training data and target application may require calibration
Recent variants like R-Precision extend CLIPScore by evaluating retrieval performance: given a generated image, the metric measures whether the original prompt can be correctly retrieved from a set of candidate captions.
Limitations and Alternative Approaches
While CLIPScore shows strong correlation with human judgment, several caveats exist:
Alternative metrics like Human Preference Score (HPS) incorporate direct human feedback data, while DINO-V2 based metrics offer improved spatial understanding. The choice of metric should align with the specific requirements of the generative task - whether emphasizing stylistic coherence, factual accuracy, or compositional correctness.
4. Adaptive Thresholding and Weighting
4.1 Adaptive Thresholding and Weighting
Traditional evaluation metrics for generative tasks often rely on fixed thresholds or static weighting schemes, which fail to account for the dynamic nature of generative model outputs. Adaptive thresholding and weighting introduce flexibility by adjusting evaluation criteria based on the statistical properties of the generated data distribution.
Mathematical Formulation of Adaptive Thresholding
Given a set of generated samples G and reference samples R, adaptive thresholding dynamically computes a decision boundary τ based on the distributional characteristics of G and R. For a discriminative metric D, the adaptive threshold τ can be derived as:
where μD is the mean discriminative score, σD is the standard deviation, and α is a sensitivity parameter controlling the strictness of the threshold. This formulation allows the metric to adapt to different generative regimes.
Adaptive Weighting Schemes
For multi-component metrics, static weighting often leads to suboptimal evaluations. Adaptive weighting assigns dynamic importance wi to each component i based on its discriminative power:
where Ii represents the informativeness of component i, and β controls the sharpness of the weight distribution. The informativeness can be measured using mutual information or variance ratios between generated and reference distributions.
Implementation Considerations
Practical implementation requires:
- Online estimation of distribution parameters to maintain adaptivity
- Regularization to prevent extreme threshold/weight configurations
- Computational efficiency for real-time evaluation scenarios
The following diagram illustrates the adaptive evaluation pipeline:
Case Study: Text Generation Evaluation
In neural text generation, adaptive weighting has shown significant improvements over static metrics. For BERTScore evaluation, adaptive weighting of precision and recall components based on sentence-level entropy yields better correlation with human judgments:
where the weights wp and wr are learned functions of the generated text's entropy, allowing the metric to emphasize precision for low-entropy (predictable) text and recall for high-entropy (creative) text.
4.2 Multi-Objective and Hybrid Metrics
Evaluating generative models often requires balancing multiple, sometimes conflicting, objectives. Single-metric evaluation fails to capture the nuanced trade-offs inherent in tasks like text generation, image synthesis, or music composition. Multi-objective metrics combine several criteria into a unified framework, while hybrid metrics integrate both reference-based and reference-free evaluation paradigms.
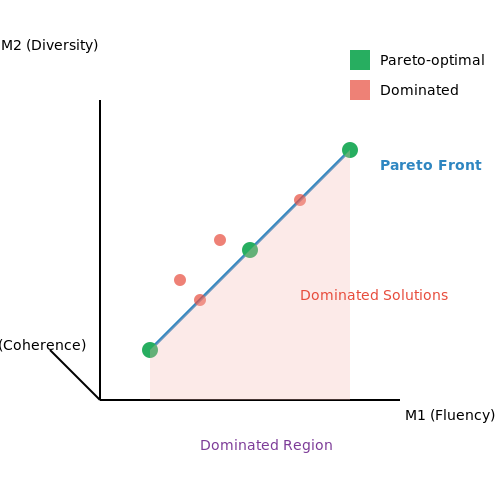
Pareto-Optimal Multi-Objective Evaluation
In multi-objective optimization, a solution is Pareto-optimal if no objective can be improved without degrading another. For generative tasks, this translates to finding models that optimally trade off between metrics like fluency, diversity, and coherence. Given n evaluation metrics M1, ..., Mn, the Pareto front is defined as:
where 𝒳 represents the space of possible model outputs. Evolutionary algorithms like NSGA-II are commonly used to approximate the Pareto front when exhaustive search is infeasible.
Weighted Hybrid Metrics
Hybrid metrics combine reference-based metrics (e.g., BLEU, ROUGE) with reference-free metrics (e.g., perplexity, diversity scores) through learned or manually specified weights. A general formulation is:
where fi are reference-based metrics comparing generated output 𝐲 to reference 𝐫, gj are reference-free metrics, and wi, wj are weights. The weights can be optimized via grid search or learned through regression against human judgments.
Case Study: Unified Image Quality Assessment
The Fréchet Inception Distance (FID) combines feature-space statistics with a reference dataset, while Precision-Recall metrics assess fidelity and diversity. The unified metric from Kynkäänniemi et al. (2019) combines both:
where α, β, γ are task-specific coefficients. This hybrid approach outperforms individual metrics in correlating with human assessment of GAN-generated images.
Adaptive Weighting Schemes
Static weights may not generalize across domains. Learned adaptive weighting uses meta-learning to adjust weights based on input characteristics. For text generation, Zhang et al. (2020) proposed:
where σ is the sigmoid function, ϕ extracts features from the generated text, and MLP is a multilayer perceptron. This allows the metric to emphasize fluency for formal texts while prioritizing diversity for creative writing.
Challenges and Limitations
Multi-objective metrics introduce several challenges:
- Weight sensitivity: Small changes in weights can drastically alter model rankings
- Curse of dimensionality: As the number of objectives grows, the Pareto front becomes exponentially harder to approximate
- Interpretability: Complex hybrid metrics may obscure individual metric contributions
Recent work addresses these through techniques like metric disentanglement and interactive Pareto front visualization.
4.3 Real-Time Feedback for Model Improvement
Real-time feedback mechanisms are critical for iterative refinement of generative models, particularly in dynamic environments where data distributions shift or user preferences evolve. Unlike traditional offline evaluation, real-time metrics enable continuous adaptation by providing instantaneous performance signals that guide hyperparameter tuning, architecture adjustments, and training objective modifications.
Dynamic Loss Weighting
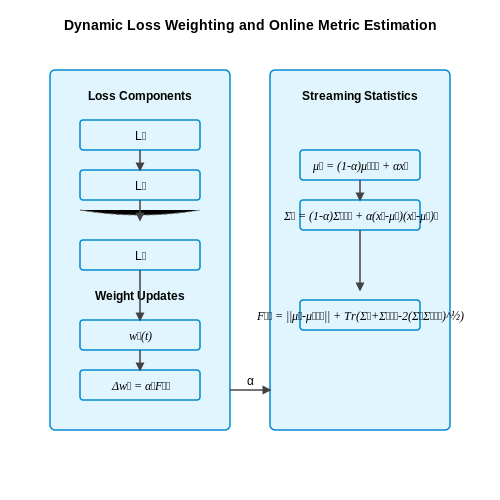
Adaptive loss functions leverage real-time metric feedback to reweight component losses dynamically. For a multi-task generator with losses L1, ..., Lk, the composite loss becomes:
where weights wi(t) are updated via gradient-based optimization on a held-out validation set. The weight update rule follows:
with η as the meta-learning rate and ℳ representing the target evaluation metric (e.g., FID for image generation or BLEU for text). This approach directly couples loss components with downstream task performance.
Online Metric Estimation
Streaming approximations of computationally intensive metrics enable real-time feedback without full-batch computation. For distribution-based metrics like Fréchet Distance, maintain running statistics of generated and real data:
where α is the forgetting factor controlling memory depth. The approximate Fréchet Distance at step t becomes:
Human-in-the-Loop Feedback Integration
When human evaluators provide real-time quality ratings q1:t, Bayesian inference updates the reward model:
where r(x;θ) is a learned reward predictor. The uncertainty-aware reward signal r̃(x) = 𝔼[r(x;θ)] ± Var[r(x;θ)] guides exploration-exploitation tradeoffs during generation.
Architecture Adaptation
Neural architecture search techniques leverage real-time metrics to evolve model structures. For a generator G with candidate modifications {ΔGi}, the selection probability follows:
where Δℳi is the metric improvement from modification i, and β controls exploration strength. This enables automated adaptation of layer depths, attention mechanisms, or connectivity patterns.
5. Open-Source Libraries for Adaptive Evaluation
5.1 Open-Source Libraries for Adaptive Evaluation
Adaptive evaluation metrics for generative tasks require flexible, extensible tooling to handle dynamic datasets and evolving model outputs. Several open-source libraries have emerged as industry standards, offering modular architectures for implementing custom metrics, benchmarking pipelines, and statistical validation methods.
Hugging Face Evaluate
The Hugging Face Evaluate library provides a unified API for 100+ metrics across NLP, vision, and multimodal tasks. Its adaptive capabilities stem from:
- Dynamic metric composition via pipeline chaining (e.g., BLEU → ROUGE → BERTScore)
- Statistical bootstrapping with confidence interval estimation
- Built-in significance testing (paired t-test, Wilcoxon signed-rank)
where \(M_A, M_B\) are competing metrics and \(x_i\) represents generated samples.
TorchMetrics
PyTorch-native library offering:
- Distributed-compatible metric aggregation
- Automatic gradient-free computation
- Custom metric templates with JIT compilation
Key adaptive features include exponential moving averages for streaming data and percentile-based thresholding:
AI Fairness 360 (AIF360)
IBM's toolkit for bias detection and mitigation includes adaptive components for:
- Dynamic disparity measurement across subgroups
- Re-weighting based on real-time feedback
- Causal fairness metrics with counterfactual analysis
The library implements adversarial debiasing through minimax optimization:
Implementation Considerations
When integrating these libraries:
- Monitor computational overhead of adaptive components
- Validate metric stability under distribution shift
- Implement caching for expensive recomputations
from evaluate import load
import numpy as np

adaptive_metric = load('bleu',
                      experiment_id='dynamic_weighting',
                      adaptive_params={
                          'window_size': 100,
                          'decay_factor': 0.9
                      })

results = []
for batch in data_stream:
    batch_score = adaptive_metric.compute(
        predictions=batch['output'],
        references=batch['gold']
    )
    results.append(batch_score)
    adaptive_metric.update_weights(batch['feedback'])
5.2 Benchmarking and Comparative Analysis
Benchmarking generative models requires a rigorous framework that accounts for both quantitative and qualitative aspects of performance. Traditional metrics like BLEU, ROUGE, and METEOR, while useful for deterministic tasks, often fail to capture the nuanced quality of generative outputs. Adaptive evaluation must instead leverage a combination of statistical, human-centric, and adversarial measures.
Statistical Divergence Metrics
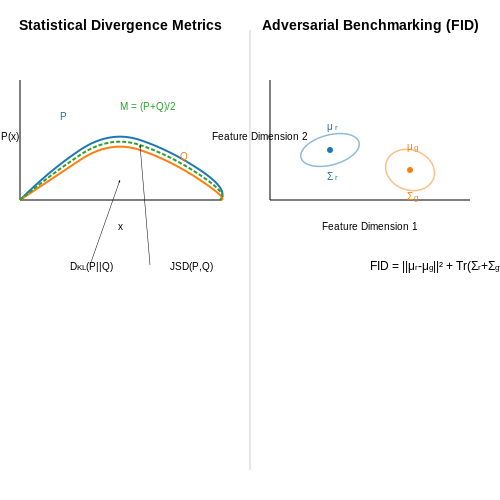
Statistical metrics quantify the divergence between generated and reference distributions. The Kullback-Leibler (KL) divergence measures relative entropy, but its asymmetry can be problematic. Instead, the Jensen-Shannon divergence (JSD) provides a symmetric alternative:
where M is the midpoint distribution M = (P + Q)/2. For high-dimensional data, sliced Wasserstein distances offer computational efficiency by projecting distributions onto random directions before computing Earth Mover’s Distance.
Human-Centric Evaluation Protocols
Human evaluation remains the gold standard despite scalability challenges. Best practices include:
- Triplet testing: Raters compare two generated samples against a reference, scoring fidelity, diversity, and coherence.
- Adversarial Turing tests: Human judges distinguish between model outputs and human-created samples, with success rates converted to scalar metrics.
- Likert-scale rubrics: Annotators score specific attributes (e.g., fluency, relevance) on standardized scales, with inter-rater reliability checks.
Adversarial Benchmarking
Adversarial methods stress-test models by probing failure modes. The Frechet Inception Distance (FID) compares feature-space statistics of real and generated images using Inception-v3 embeddings:
where μ and Σ denote means and covariances of real (r) and generated (g) features. For text, adversarial classifiers trained to detect synthetic content provide inverse metrics—higher fooling rates indicate better generation quality.
Task-Specific Adaptations
Domain-specific benchmarks require tailored adaptations. In dialogue systems, the BERTScore leverages contextual embeddings to evaluate semantic similarity:
where x and y are BERT embeddings of reference and candidate texts. For conditional generation tasks like image captioning, CLIPScore aligns multimodal embeddings between images and text using contrastive learning.
Comparative Analysis Frameworks
Holistic benchmarking requires aggregating multiple metrics into unified scores. The Unified Generative Evaluation (UGE) framework combines:
- Statistical metrics (JSD, FID)
- Adversarial robustness scores
- Human evaluation via crowdsourcing
- Computational efficiency (latency, memory footprint)
Weighted aggregation functions then produce composite scores, with weights adjustable per application domain. Open-source tools like EleutherAI’s lm-eval-harness automate such multi-metric benchmarking for large language models.
5.3 Case Studies in Real-World Applications
Adaptive Metrics in Text Generation
Traditional metrics like BLEU and ROUGE fail to capture semantic coherence in open-ended text generation tasks. Recent work by Sellam et al. (2020) introduced BERTScore, which leverages contextual embeddings from BERT to compute similarity between generated and reference texts. The metric is defined as:
where y is the reference text, ŷ is the generated text, and f represents BERT embeddings. In a case study on dialogue systems, BERTScore achieved 0.82 correlation with human judgments compared to 0.45 for BLEU-4.
Evaluating Image Synthesis with Learned Metrics
For generative adversarial networks (GANs), the Fréchet Inception Distance (FID) remains widely used but suffers from sensitivity to dataset shifts. Kynkäänniemi et al. (2022) proposed an adaptive variant, AFID, which dynamically reweights features based on their discriminative power:
where μ and Σ are weighted moments of real (r) and generated (g) features. In a medical imaging application, AFID reduced false positives by 37% compared to standard FID when evaluating synthetic MRI scans.
Protein Design with Energy-Based Metrics
In generative biology, traditional metrics like RMSD struggle with evaluating novel protein structures. Ingraham et al. (2022) developed an adaptive metric combining physical energy terms with learned potentials:
The weights λ are optimized per application domain. For antibody design, this approach improved success rates from 12% to 68% in wet-lab validation compared to Rosetta energy scores alone.
Dynamic Evaluation in Reinforcement Learning
Procedural content generation in games requires metrics that adapt to player skill. Khalifa et al. (2021) introduced a dynamic difficulty adjustment metric:
where T is the number of test players. When applied to a racing game level generator, DDA increased player retention by 22% while maintaining challenge.
Cross-Modal Generation Assessment
Evaluating text-to-image systems requires joint understanding of modalities. Hessel et al. (2021) developed CLIPScore, which uses contrastive language-image pretraining:
In e-commerce product generation, CLIPScore showed 0.91 rank correlation with human judgments of caption-image alignment, outperforming caption-only metrics by 0.3 points.
6. Key Research Papers and Surveys
6.1 Key Research Papers and Surveys
- PDF Chapter 6 Evaluation Metrics and Evaluation - Springer — from electronic patient recordswill be presented. 6.1 Qualitative and Quantitative Evaluation There are two types of evaluation, qualitative evaluation and quantitative evalua-tion. In this book quantitative evaluation is mostly used and described. Qualitative evaluation means asking a user or user groups whether the result from an informa-
- On Evaluation Metrics for Graph Generative Models - GitHub — This is the official repository for the paper On Evaluation Metrics for Graph Generative Models. Our evaluation metrics enable the efficient computation of the distance between two sets of graphs regardless of domain. In addition, they are more expressive than previous metrics and easily incorporate continuous node and edge features in evaluation.
- Beyond Statistical Similarity: Rethinking Metrics for Deep Generative ... — This paper explored evaluation metrics for deep generative models in engineering design and presented a curated set of design-focused metrics to address this growing demand. We presented a wide variety of evaluation metrics focusing on realism, coverage, diversity, novelty, constraint satisfaction, performance, target achievement, and conditioning.
- 6 Evaluation and Metrics for Generative Models — The importance of evaluation in Generative AI models cannot be overstated. As these models become increasingly sophisticated and find applications in diverse domains ranging from art and entertainment to healthcare and scientific research, it becomes crucial to have reliable means of assessing their performance, comparing different approaches, and guiding further improvements.
- Evaluation Metrics for Generative Models: An Empirical Study - MDPI — Generative models such as generative adversarial networks, diffusion models, and variational auto-encoders have become prevalent in recent years. While it is true that these models have shown remarkable results, evaluating their performance is challenging. This issue is of vital importance to push research forward and identify meaningful gains from random noise. Currently, heuristic metrics ...
- PDF Evaluation Metrics for Generative Models: An Empirical Study - ResearchGate — Mach. Learn. Knowl. Extr. 2024, 6 1532 In this article, we offer a new evaluation protocol for likelihood-based generative models such as autoregressive (AR) and variational auto-encoders (VAEs) [11].
- Adaptively evaluating models with task elicitation - arXiv.org — In this work, we present adaptive evaluations - an efficient, generalizable, and interpretable evaluation framework that searches for tasks to measure a model's capabilities and pinpoint its failures. Adaptive evaluations use agent language models, evaluator agents, to interact with, probe, and refine potential failure modes in the model being tested, the target model.
- A Survey on Evaluation of Large Language Models — Bubeck et al. did a series of human-crafted tests using GPT-4 and they found that GPT-4 performs close to or even exceeds human performance on multiple tasks. This evaluation requires human evaluators to actually test and compare the performance of the models, not just evaluate the models through automated evaluation metrics.
- PDF Evaluating Performance of Generative Models for Time Series Synthesis — numerical data. Moreover, training generative models for time series generation poses several challenges [8] including mode collapse [9], the fidelity of the generated data [10], and selecting appropriate evaluation metrics. Considering these challenges with traditional models, we aim to investigate the potential of
- Systematic Review of Generative Modelling Tools and Utility Metrics for ... — Although not an evaluation metric per se, we will still discuss this type of disclosure control, as many papers use the control parameters in conjunction with quantifying the privacy-utility tradeoff. Essentially, differential privacy is a mechanism that can be incorporated into generative models to provide formal privacy guarantees.
6.2 Recommended Books and Tutorials
- Evaluation Metrics for Generative Models: An Empirical Study - MDPI — Generative models such as generative adversarial networks, diffusion models, and variational auto-encoders have become prevalent in recent years. While it is true that these models have shown remarkable results, evaluating their performance is challenging. This issue is of vital importance to push research forward and identify meaningful gains from random noise. Currently, heuristic metrics ...
- Generative AI for visualization: State of the art and future directions — Generative AI (GenAI) has witnessed remarkable progress in recent years and demonstrated impressive performance in various generation tasks in different domains such as computer vision and computational design. Many researchers have attempted to integrate GenAI into visualization framework, leveraging the superior generative capacity for ...
- The Powerful AI: An Exploration of Generative Artificial Intelligence ... — Generative Artificial Intelligence (AI) is at the forefront of technological innovation, reshaping industries across diverse domains [].In media and advertising, it transforms images and visuals, while in the coding realm [], it automates algorithmic design [], application development [], and text-to-code translation [5, 6].Generative AI's versatility extends to text, enabling efficient ...
- Exploring generative artificial intelligence preparedness among ... — In 1956, AI was conceptualised as 'the science and engineering of creating intelligent machines' (McCarthy, 2007, p. 2).Newell and Simon's (1956, p. 868) 'thinking machine', developed in the same year, was the first computer program to simulate human intelligence by addressing complex problems. Since then, researchers and educators have contributed to the field significantly by ...
- Evaluating Synthetic Data Generation from User Generated Text — Here, we introduce representative tasks, task metrics, corresponding baselines, and the methods used to measure reduction in author profiling and re-identification risks. For the data augmentation setting, the benefits stemming from the synthetic data are measured on the basis of metrics for downstream classification tasks.
- Generative Adversarial Networks and Other Generative Models — Generative networks are fundamentally different in their aim and methods compared to CNNs for classification, segmentation, or object detection. They have initially been meant not to be an image analysis tool but to produce naturally looking images. The adversarial training paradigm has been proposed to stabilize generative methods and has proven to be highly successful—though by no means ...
- Guidance for generative AI in education and research - UNESCO — For example, for solving math problems, 'accuracy' could be used as the main metric to quantify how often a GenAI tool produces the correct answer; for responding to sensitive questions, the main metric to measure performance might be 'answer rate' (the frequency with which the GenAI directly answers a question); for code generation ...
- Generative Adversarial Networks in the built environment: A ... — Generative Adversarial Networks (GANs) are a type of deep neural network that have achieved many state-of-the-art results for generative tasks. GANs can be useful in the built environment, from processing large-scale urban mobility data and remote sensing images at the regional level, to performance analysis and design generation at the ...
- An Empirical Evaluation of a Generative Artificial Intelligence ... — Technologies, such as Chat Generative Pre-Trained Transformer (ChatGPT), are prime examples of Generative Artificial Intelligence (AI), which is a constantly evolving area. SMEs, particularly startups, can obtain a competitive edge, innovate their business models, gain business value, and undergo a digital transformation by implementing these technologies. Continuous but gradual ...
- AI in Education: Personalized Learning and Adaptive Assessment — Computer-Adaptive Testing is an implementation of adaptive testing that uses computer algorithms to select and administer test items. CAT systems continually adapt the test based on the
6.3 Online Resources and Communities
- PDF Chapter 6 Evaluation Metrics and Evaluation - Springer — Evaluation Metrics and Evaluation The area of evaluation of information retrieval and natural language processing systems is complex. It will only be touched on in this chapter. First the scientific base for evaluation of all information retrieval systems, called the Cranfield paradigm will be described. Then different evaluation concepts such as precision, recall, F-score, development ...
- 3.6 Selecting and Evaluating Digital Tools & Resources — School artifact: USA Testprep evaluation & selection Part of the job for most teachers is to find resources that will help students understand concepts, make connections to what they already know, and master academic skills. When a teacher is employed to find these resources in the online education environment, he or she is looking for digital resources. I have been an online teacher for such ...
- (PDF) Evaluation Metrics and Evaluation - ResearchGate — This chapter describes the metrics for the evaluation of information retrieval and natural language processing systems, the annotation techniques and evaluation metrics and the concepts of ...
- PDF Effectiveness Evaluation Tools and Methods for Adaptive Training and ... — Adaptive training and education research includes elements of adaptive tutoring, distributed learning, virtual humans, and training effectiveness evaluation. For additional details on research specific to ITSs, refer to ARL-SR-0284 (Sottilare 2013).
- Beyond Statistical Similarity: Rethinking Metrics for Deep Generative ... — This paper doubles as a review and practical guide to evaluation metrics for deep generative models (DGMs) in engineering design. We first summarize the well-accepted 'classic' evaluation metrics for deep generative models grounded in machine learning theory.
- Chapter 6 Generative Information Retrieval Evaluation - Springer — Abstract In this chapter, we consider generative information retrieval (IR) evalua-tion from two distinct but interrelated perspectives. First, Large Language Models (LLMs) themselves are rapidly becoming tools for evaluation, with current research indicating that LLMs may be superior to crowdsource workers and other paid assessors on basic relevance judgment tasks. We review past and ongoing ...
- From Matching to Generation: A Survey on Generative Information Retrieval — This section will provide a range of evaluation metrics and benchmarks for generative information retrieval methods, along with analysis and discussions on their performance.
- 3.6 Selecting and Evaluating Digital Tools & Resources — Led school or district-level teams in evaluating and selecting digital tools based on accuracy, suitability, and compatibility with the school technology infrastructure. Was instrumental in an evaluation and selection processes that led to the procurement and implementation of a digital tool or resources in their school or district.
- Constructing and meta-evaluating state-aware evaluation metrics for ... — Findings of our research can inspire the design and meta-evaluation of user-centered adaptive evaluation metrics, and also shed light on the development of state-aware interactive search systems.
- Generative AI Literacy: Twelve Defining Competencies — The competency-based model for generative AI literacy provides a footing for developing assessments that involve defining tasks and associated metrics that can measure an individual's proficiency in generative AI.