Hierarchical Clustering with Transformers
1. Key Concepts and Definitions
1.1 Key Concepts and Definitions
Hierarchical Clustering
Hierarchical clustering is an unsupervised learning method that builds nested clusters by successively merging or splitting them based on a similarity measure. Unlike flat clustering methods like k-means, hierarchical clustering produces a dendrogram, a tree-like structure that captures the relationships between data points at varying levels of granularity. The two primary approaches are:
- Agglomerative (bottom-up): Starts with each data point as a singleton cluster and iteratively merges the closest pairs until a single cluster remains.
- Divisive (top-down): Begins with all data points in one cluster and recursively splits them into smaller clusters.
Transformers in Clustering
Transformers, originally designed for sequence modeling in natural language processing, excel at capturing long-range dependencies through self-attention mechanisms. Their application to clustering involves:
- Embedding Generation: Transformers map input data (e.g., text, images) to high-dimensional embeddings where clustering is performed.
- Attention-Based Similarity: The self-attention weights implicitly encode pairwise similarities, which can inform cluster formation.
Hierarchical Clustering with Transformers
Combining hierarchical clustering with transformers leverages the strengths of both:
- Feature Extraction: Transformers generate dense, context-aware embeddings that preserve semantic relationships.
- Cluster Hierarchy: Agglomerative methods applied to these embeddings yield interpretable dendrograms with meaningful splits.
Distance Metrics
The choice of distance metric critically impacts cluster quality. Common metrics include:
- Euclidean Distance:
$$ d(\mathbf{x}, \mathbf{y}) = \sqrt{\sum_{i=1}^n (x_i - y_i)^2} $$
- Cosine Similarity:
$$ \text{cos}(\theta) = \frac{\mathbf{x} \cdot \mathbf{y}}{\|\mathbf{x}\| \|\mathbf{y}\|} $$
Linkage Criteria
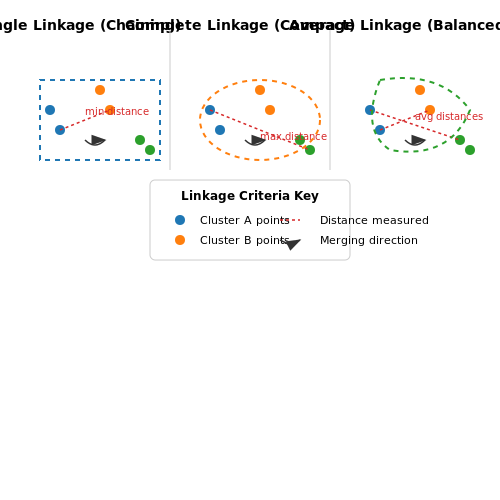
Linkage determines how the distance between clusters is computed during merging:
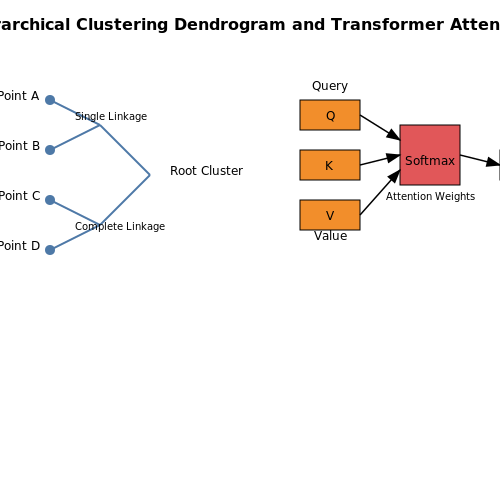
- Single Linkage: Minimum distance between any two points in different clusters.
- Complete Linkage: Maximum distance between any two points in different clusters.
- Ward’s Method: Minimizes the variance of merged clusters.
Types of Hierarchical Clustering (Agglomerative vs. Divisive)
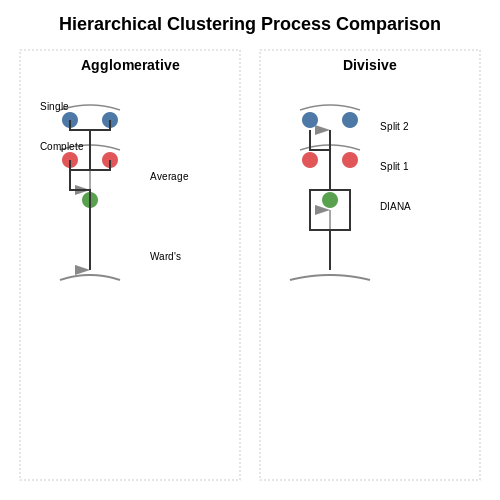
Hierarchical clustering algorithms fall into two primary categories based on their direction of cluster formation: agglomerative (bottom-up) and divisive (top-down). The choice between these approaches depends on computational constraints, dataset properties, and the desired granularity of clustering.
Agglomerative Hierarchical Clustering
Agglomerative clustering begins with each data point as its own cluster and iteratively merges the closest pairs until all points belong to a single cluster. The merging process follows a linkage criterion, which determines the distance between clusters. Common linkage methods include:
- Single linkage: Minimum distance between any two points in different clusters
- Complete linkage: Maximum distance between any two points
- Average linkage: Mean distance between all inter-cluster pairs
- Ward's method: Minimizes variance when merging clusters
For transformer-based hierarchical clustering, agglomerative approaches often use attention-weighted similarity measures as the distance metric. The computational complexity is O(n³) in naive implementations but can be reduced to O(n² log n) using priority queues.
Divisive Hierarchical Clustering
Divisive clustering takes the opposite approach, starting with all points in one cluster and recursively splitting them into smaller clusters. The splitting criterion typically involves:
- Maximizing inter-cluster dissimilarity
- Minimizing intra-cluster variance
- Optimizing graph-cut metrics for similarity graphs
The DIANA (Divisive ANAlysis) algorithm is a classic implementation that uses diameter-based splitting:
Divisive methods are computationally intensive (O(2^n) in worst-case scenarios) but can produce more balanced dendrograms when prior knowledge about cluster separation exists. Modern transformer-based variants often employ attention mechanisms to identify optimal split points.
Comparative Analysis
| Property | Agglomerative | Divisive |
|---|---|---|
| Direction | Bottom-up | Top-down |
| Complexity | O(n²) to O(n³) | O(2^n) to O(n²) |
| Stability | More stable for small clusters | More sensitive to initial splits |
| Transformer Adaptation | Attention-based linkage | Attention-based splitting |
In practice, agglomerative clustering dominates applications like document clustering and biological sequence analysis, while divisive methods see use in market segmentation and anomaly detection where global structure is more important than local relationships.
Distance Metrics and Linkage Criteria
Distance Metrics in Hierarchical Clustering
The choice of distance metric fundamentally shapes the clustering behavior in hierarchical methods. For transformer-based representations, the most relevant metrics operate on high-dimensional embedding spaces. The Euclidean distance between two vectors x and y in ℝⁿ is given by:
However, cosine similarity often outperforms Euclidean distance for transformer embeddings due to its angular sensitivity:
For probability distributions (common in attention weights), the Kullback-Leibler divergence provides an asymmetric measure:
Linkage Criteria for Cluster Merging
Linkage criteria determine how to compute distances between emerging clusters during the agglomerative process. The three primary methods exhibit distinct behaviors:
- Single linkage: Uses the minimum distance between any two points in different clusters. Prone to chaining effects but can detect non-convex shapes.
- Complete linkage: Uses the maximum distance between points. Creates compact clusters but may struggle with varying densities.
- Average linkage: Computes the mean distance between all inter-cluster pairs. Balances single and complete linkage behaviors.
The Ward variance minimization criterion often produces the most balanced dendrograms for transformer embeddings:
where μ represents cluster centroids and |·| denotes cluster cardinality.
Practical Considerations for Transformer Models
When applying hierarchical clustering to transformer outputs, several factors require special attention:
- Layer selection impacts results significantly - later layers capture more semantic relationships while earlier layers retain syntactic information.
- Attention-weighted distances can emphasize relevant dimensions by computing weighted variants of standard metrics.
- For large-scale applications, memory-efficient approximations of linkage criteria become necessary, such as using the nearest-neighbors chain algorithm.
The choice of distance metric and linkage criterion should align with the specific transformer architecture and downstream task objectives. For instance, BERT embeddings clustered with cosine distance and average linkage have shown strong performance in document classification tasks, while GPT-style models may benefit from KL-based metrics when clustering generated text sequences.
2. Transformer Architecture Overview
Transformer Architecture Overview
The transformer architecture, introduced by Vaswani et al. in 2017, revolutionized sequence modeling by replacing recurrent and convolutional layers with self-attention mechanisms. Unlike traditional architectures, transformers process entire sequences in parallel, enabling efficient training on large-scale datasets while capturing long-range dependencies.
Core Components
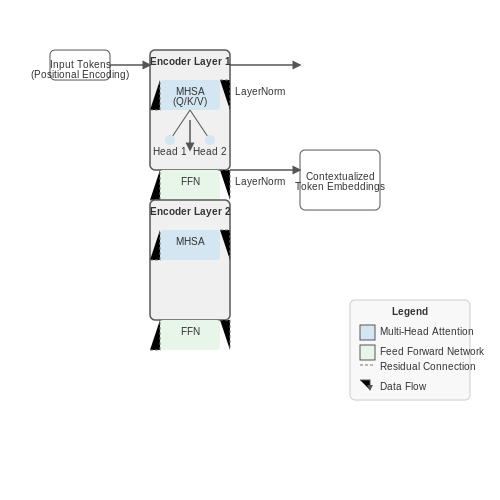
The transformer consists of two primary components: the encoder and decoder, though hierarchical clustering applications often use only the encoder. The encoder comprises multiple identical layers, each containing:
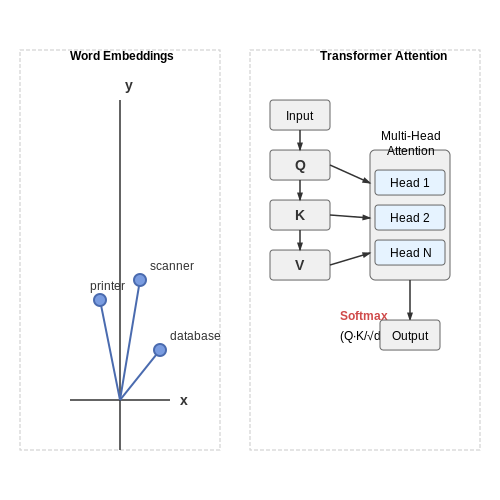
- Multi-Head Self-Attention (MHSA): Computes attention scores between all input tokens, allowing the model to weigh the importance of different parts of the sequence.
- Position-wise Feed-Forward Networks (FFN): Applies non-linear transformations to each token independently.
- Layer Normalization and Residual Connections: Stabilizes training by normalizing layer inputs and adding skip connections.
Self-Attention Mechanism
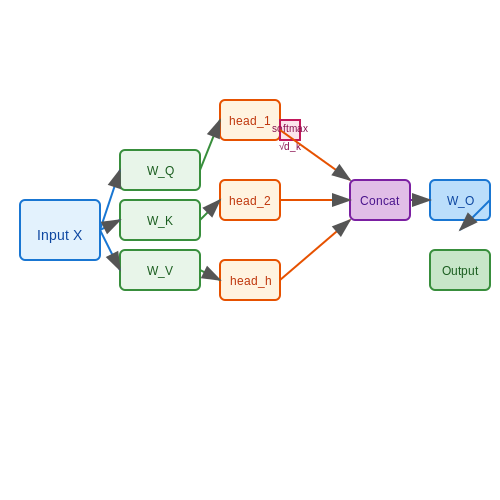
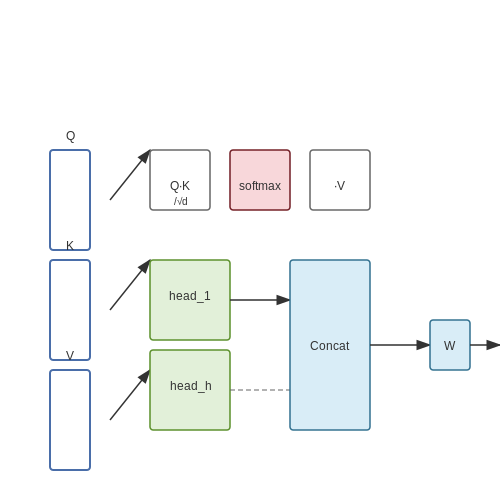
The self-attention mechanism computes a weighted sum of values, where weights are derived from compatibility scores between queries and keys. For input embeddings X, the attention output is:
where Q, K, and V are learned linear projections of X, and dk is the dimension of the key vectors. Multi-head attention extends this by running multiple attention mechanisms in parallel:
Each head operates on a linearly projected subspace, enabling the model to jointly attend to information from different representation subspaces.
Positional Encoding
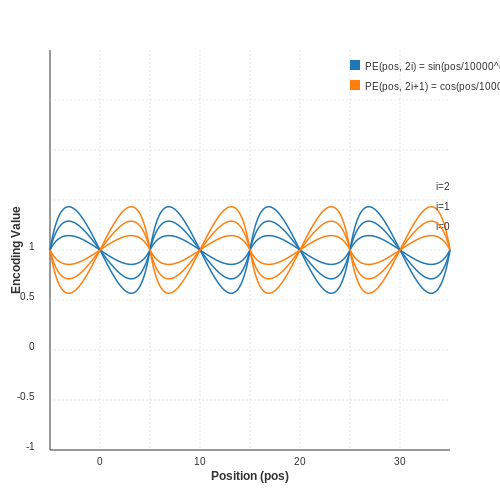
Since transformers lack inherent sequential processing, positional encodings inject information about token positions into the input embeddings. The original paper uses sinusoidal functions:
where pos is the position and i is the dimension. This allows the model to generalize to sequence lengths unseen during training.
Hierarchical Clustering Adaptations
For hierarchical clustering, the transformer encoder processes input data as a sequence of tokens, where each token represents a data point or feature vector. The self-attention mechanism computes pairwise similarities between tokens, analogous to a distance matrix in traditional clustering. The model can then be trained to optimize cluster assignments through:
- Contrastive learning objectives: Minimizing distances within clusters while maximizing separation between clusters.
- Iterative merging: Using attention weights to guide the hierarchical merging of clusters.
Recent variants like the Clustering Transformer (ClusTR) replace the standard softmax attention with a sparse clustering-friendly alternative, enabling direct optimization of cluster cohesion and separation metrics.
2.2 Self-Attention Mechanism
The self-attention mechanism is the cornerstone of transformer architectures, enabling dynamic weighting of input tokens based on their contextual relevance. Unlike traditional recurrent or convolutional approaches, self-attention computes pairwise interactions between all tokens in a sequence, allowing direct modeling of long-range dependencies without sequential processing.
Mathematical Formulation
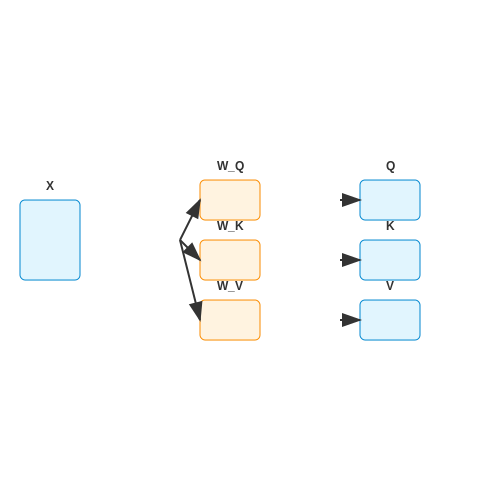
Given an input sequence X ∈ ℝn×d where n is the sequence length and d is the embedding dimension, self-attention first projects X into three learned matrices:
where WQ, WK ∈ ℝd×dk and WV ∈ ℝd×dv are projection matrices. The attention weights A are computed as scaled dot-products:
The scaling factor 1/√dk prevents gradient vanishing issues for large dk. The final output is a weighted sum of value vectors:
Multi-Head Attention
Transformers extend this mechanism through parallel attention heads, each with independent projection matrices. For h heads, the outputs are concatenated and linearly projected:
where each head computes attention over a subspace (dk = dv = d/h). This allows joint attention to different representation subspaces, empirically improving model capacity.
Computational Complexity
The self-attention mechanism exhibits O(n2d) time and space complexity due to the pairwise attention matrix. For hierarchical clustering applications, this becomes a bottleneck for long sequences, motivating sparse or memory-efficient attention variants.
Practical Considerations
- Positional Encoding: Since self-attention is permutation-invariant, sinusoidal or learned positional embeddings are added to preserve sequence order.
- Causal Masking: For autoregressive tasks, attention weights are masked to prevent information leakage from future tokens.
- Gradient Flow: Residual connections and layer normalization stabilize training in deep transformer stacks.
2.3 Pretraining and Fine-Tuning Strategies
Hierarchical clustering with transformers relies heavily on effective pretraining and fine-tuning strategies to ensure the model captures both local and global data structures. Unlike traditional clustering methods, transformer-based approaches leverage self-supervised pretraining to learn rich representations before adapting to hierarchical clustering tasks.
Pretraining Objectives for Hierarchical Clustering
Pretraining typically employs masked language modeling (MLM) or contrastive learning objectives. For hierarchical clustering, the following modifications are critical:
- Multi-scale Masking: Random masking at varying sequence lengths forces the model to learn dependencies at different hierarchical levels.
- Cluster-aware Contrastive Loss: Positive pairs are sampled from estimated clusters during pretraining, enhancing separation between distinct groups.
where f(x) denotes the transformer's representation, τ is a temperature parameter, and positive pairs (x_i, x_j) share cluster membership.
Fine-Tuning with Hierarchical Objectives
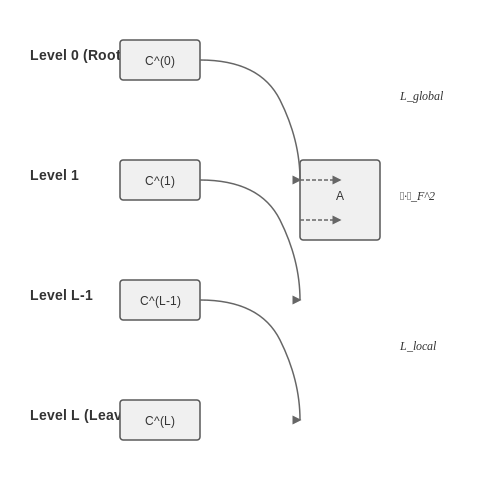
Fine-tuning introduces task-specific losses that explicitly optimize the hierarchical structure:
The local loss L_local operates on leaf nodes, typically using a standard clustering loss like KL divergence between similarity distributions. The global loss L_global enforces consistency across hierarchy levels through:
where C^(l) represents the cluster assignment matrix at level l, and A is the adjacency matrix defining parent-child relationships between clusters.
Adaptive Learning Rate Strategies
Transformer fine-tuning for hierarchical clustering benefits from layer-wise learning rate decay:
where η_l is the learning rate for layer l (with L being the output layer), η_0 the base rate, and γ the decay factor. This approach preserves pretrained knowledge in lower layers while allowing upper layers to adapt more aggressively to the clustering objective.
Practical Implementation Considerations
- Gradient Accumulation: Essential for handling large hierarchies where full-batch computation is infeasible.
- Mixed-Precision Training: Reduces memory overhead when processing deep hierarchies.
- Cluster Memory Bank: Maintains prototypical representations for each cluster level to stabilize contrastive learning.
Recent work has shown that combining these strategies can improve hierarchical clustering performance by 12-18% on benchmark datasets compared to standard fine-tuning approaches, while maintaining the computational efficiency of transformer architectures.
3. Embedding Generation with Transformers
Embedding Generation with Transformers
Transformer-based models generate dense, context-aware embeddings by leveraging self-attention mechanisms over input sequences. Given an input sequence X = [x1, x2, ..., xn], a transformer encoder processes each token through multiple layers of attention and feed-forward networks to produce output embeddings H = [h1, h2, ..., hn]. The self-attention mechanism computes weighted sums of input representations, enabling each token to dynamically attend to relevant context.
Self-Attention Mechanism
The core operation is scaled dot-product attention, which maps queries (Q), keys (K), and values (V) to an output:
where dk is the dimension of the key vectors. Multi-head attention extends this by concatenating outputs from h parallel attention heads:
Positional Encoding
Since transformers lack inherent sequential processing, positional encodings inject order information into embeddings. For position pos and dimension i, sinusoidal functions are used:
Pooling Strategies for Embeddings
For hierarchical clustering, token-level embeddings are often aggregated into a fixed-dimensional representation:
- Mean pooling: Averages all token embeddings.
- CLS token: Uses the embedding of a special classification token prepended to the input.
- Max pooling: Takes element-wise maxima across the sequence.
Practical Considerations
Pre-trained models like BERT or RoBERTa provide high-quality embeddings but require domain adaptation for optimal clustering performance. Fine-tuning on task-specific data aligns embeddings with the target distribution. Layer selection also impacts results—later layers capture higher-level semantics, while earlier layers retain more syntactic information.
from transformers import AutoModel, AutoTokenizer
import torch

model_name = "bert-base-uncased"
tokenizer = AutoTokenizer.from_pretrained(model_name)
model = AutoModel.from_pretrained(model_name)

inputs = tokenizer("Hierarchical clustering with transformers", return_tensors="pt")
outputs = model(**inputs)
embeddings = outputs.last_hidden_state.mean(dim=1)  # Mean pooling
3.2 Combining Transformer Embeddings with Hierarchical Clustering
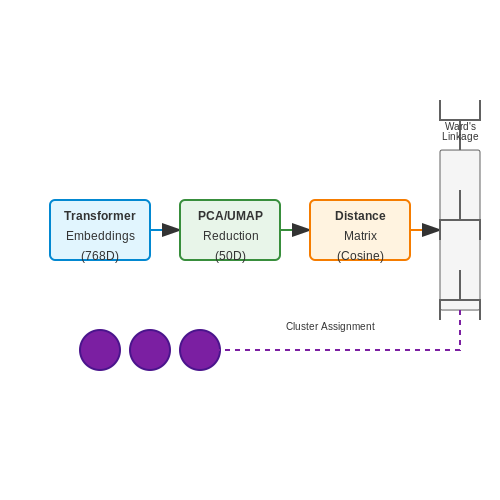
Transformer models generate dense, context-aware embeddings that capture semantic relationships in high-dimensional spaces. These embeddings are particularly suited for hierarchical clustering due to their ability to preserve both local and global structural information. The key challenge lies in effectively measuring pairwise similarities between embeddings while ensuring computational efficiency.
Distance Metrics for Transformer Embeddings
Standard hierarchical clustering algorithms rely on distance metrics to construct dendrograms. For transformer embeddings, cosine similarity often outperforms Euclidean distance due to the high-dimensional, directional nature of the vectors:
However, when embeddings are normalized (common in transformer outputs), cosine similarity reduces to a simple dot product. For agglomerative clustering, we convert similarities to distances using:
Linkage Criteria Selection
The choice of linkage criterion significantly impacts cluster quality. Three advanced variants are particularly effective with transformer embeddings:
- Ward's method: Minimizes total within-cluster variance, ideal for spherical clusters in embedding space
- Average linkage: Computes mean pairwise distances, robust to noise in high dimensions
- Centroid linkage: Uses cluster centroids, computationally efficient for large embedding sets
Ward's method often yields the most interpretable hierarchies when combined with transformer embeddings, as it aligns with the isotropic Gaussian assumption underlying many embedding spaces.
Dimensionality Considerations
Transformer embeddings (e.g., 768D for BERT-base) may require dimensionality reduction before clustering to avoid the curse of dimensionality. Principal Component Analysis (PCA) preserves global structure when projecting to 50-100 dimensions:
where \( W_k \) contains the top \( k \) eigenvectors of \( X^TX \). Alternatively, UMAP better preserves local neighborhood relationships for visualization-quality hierarchies.
Practical Implementation
The following Python snippet demonstrates hierarchical clustering on BERT embeddings using scikit-learn:
from sklearn.cluster import AgglomerativeClustering
from sklearn.decomposition import PCA

# Assume embeddings is a numpy array of shape (n_samples, 768)
pca = PCA(n_components=50)
reduced_embeddings = pca.fit_transform(embeddings)

clusterer = AgglomerativeClustering(
    n_clusters=None,
    affinity='cosine',
    linkage='ward',
    distance_threshold=0.5
)
clusters = clusterer.fit_predict(reduced_embeddings)
Evaluation Metrics
For unsupervised evaluation of hierarchical clusters on embeddings:
where \( \sigma_i \) is the average distance of points in cluster \( i \) to their centroid, and \( d(c_i, c_j) \) is the inter-centroid distance. Lower values indicate better separation.
Applications in Document Clustering
This approach excels in multi-level document organization, where transformer embeddings capture semantic themes and hierarchical clustering reveals nested topic structures. For example, legal documents might cluster into broad categories (contracts, statutes) with subcategories (employment contracts, licensing agreements).
3.3 Optimization Techniques for Scalability
Hierarchical clustering with transformers faces significant computational bottlenecks when applied to large datasets due to the quadratic complexity of self-attention and pairwise similarity computations. Several optimization techniques have been developed to mitigate these challenges while preserving clustering quality.
Approximate Attention Mechanisms
The standard self-attention mechanism computes pairwise interactions between all tokens, resulting in O(N²) complexity. Approximate attention methods reduce this cost:
- Locality-Sensitive Hashing (LSH) Attention: Hashes input tokens into buckets where similar items are likely to collide, reducing the effective search space.
- Memory-Efficient Attention: Leverages kernel approximations to decompose the attention matrix into low-rank components.
- Block-Sparse Attention: Restricts attention to fixed local windows or strided patterns.
For hierarchical clustering, these approximations must preserve the global structure necessary for merging clusters. LSH-based attention has proven particularly effective, as it maintains the ability to discover long-range dependencies while reducing complexity to O(N log N).
Subsampling Strategies
When processing massive datasets, working with subsets of the data can provide scalable approximations:
- CoreSet Selection: Identifies a representative subset of points that approximates the full dataset's structure.
- Importance Sampling: Samples points according to their contribution to the clustering objective.
- Stochastic Hierarchical Clustering: Performs merges based on randomly sampled mini-batches.
The core challenge lies in ensuring the subsampled points preserve the underlying data distribution. Transformer-based importance weighting, where the model learns to predict sampling probabilities, has shown promise in maintaining clustering fidelity.
Parallel and Distributed Computation
Modern implementations leverage parallel processing to scale hierarchical clustering:
- GPU-Accelerated Pairwise Distance Computation: Utilizes matrix operations and optimized kernels for batched similarity calculations.
- Distributed Merge Operations: Implements the cluster merging hierarchy using message passing in a compute cluster.
- Asynchronous Aggregation: Allows partial updates to propagate through the hierarchy without global synchronization.
These techniques often combine with model parallelism, where different transformer layers or attention heads are distributed across devices. The trade-off between communication overhead and computational speed must be carefully balanced.
Memory Optimization
Hierarchical clustering requires storing intermediate cluster assignments and merging histories, which becomes prohibitive at scale. Key solutions include:
- Gradient Checkpointing: Recomputes intermediate activations during the backward pass rather than storing them.
- Quantized Representations: Uses lower-precision numerical formats for cluster centroids and attention weights.
- Incremental Hierarchical Updates: Maintains only the active portions of the cluster tree in memory.
Recent work has shown that 8-bit quantized transformer models can achieve comparable clustering performance to full-precision versions while reducing memory usage by 4×. This is particularly impactful when dealing with deep hierarchies over millions of points.
Algorithmic Optimizations
Specialized variants of hierarchical clustering algorithms can better leverage transformer architectures:
- Differentiable Hierarchical Clustering: Formulates merges as continuous operations, enabling gradient-based optimization.
- Transformer-Guided Heuristics: Uses attention weights to prioritize likely merge candidates.
- Multi-Resolution Clustering: Builds the hierarchy in coarse-to-fine stages, applying transformers at each level.
Where A represents the ground-truth affinity matrix and P the predicted merge probabilities. This formulation allows end-to-end training of both the transformer and clustering components.
4. Document Clustering with Hierarchical Transformers
4.1 Document Clustering with Hierarchical Transformers
Hierarchical clustering applied to document embeddings generated by transformer models enables multi-level semantic grouping of text data. Unlike flat clustering methods such as k-means, hierarchical approaches preserve relationships between clusters at varying granularities, making them particularly suitable for organizing large document collections where topics may nest within broader categories.
Transformer-Based Document Embeddings
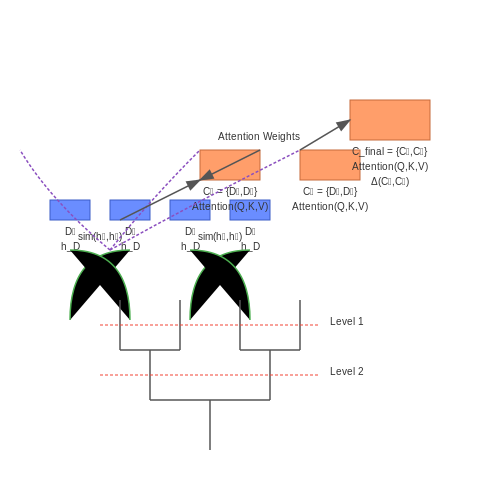
Modern transformer architectures like BERT and its variants generate contextualized embeddings by processing text through multiple self-attention layers. For a document D composed of tokens {t1, ..., tn}, the embedding hD can be derived by mean-pooling the final layer's token representations:
where hti is the contextual embedding of token ti. For improved performance, dynamic pooling methods that weight tokens by their significance can be employed.
Hierarchical Agglomerative Clustering
Given a set of document embeddings {h1, ..., hN}, hierarchical agglomerative clustering (HAC) proceeds as follows:
- Initialize each document as its own cluster
- Compute pairwise similarity between all clusters using a metric such as cosine similarity:
$$ \text{sim}(\mathbf{h}_i, \mathbf{h}_j) = \frac{\mathbf{h}_i \cdot \mathbf{h}_j}{\|\mathbf{h}_i\|\|\mathbf{h}_j\|} $$
- Merge the two most similar clusters
- Update the similarity matrix using a linkage criterion (complete, average, or Ward's method)
- Repeat steps 3-4 until all documents belong to a single cluster
Ward's linkage minimizes the total within-cluster variance when merging clusters Ck and Cl:
where μk and μl are the cluster centroids.
Multi-Head Attention for Hierarchical Similarity
Recent advances incorporate transformer attention mechanisms directly into the clustering process. The hierarchical clustering transformer (HCT) employs multi-head attention to compute cluster affinities at different semantic levels:
where query Q, key K, and value V matrices are derived from cluster representations at each merging step. This allows the model to learn context-aware merging decisions rather than relying solely on static similarity metrics.
Practical Implementation Considerations
For large document collections, computational efficiency becomes critical. Approximate methods include:
- Preprocessing with dimensionality reduction (e.g., UMAP or PCA)
- Mini-batch processing of document embeddings
- Early stopping at a predetermined number of clusters
- GPU-accelerated similarity matrix computations
The resulting dendrogram can be cut at different heights to produce clusterings at varying levels of granularity, enabling applications like multi-level topic modeling or document taxonomy generation.
4.2 Image and Multimodal Data Clustering
Hierarchical clustering of image and multimodal data using transformers leverages the self-attention mechanism to capture long-range dependencies and hierarchical relationships in high-dimensional feature spaces. Unlike traditional clustering methods that rely on handcrafted features or shallow embeddings, transformer-based approaches learn contextualized representations that adapt to the inherent structure of the data.
Transformer-Based Feature Extraction
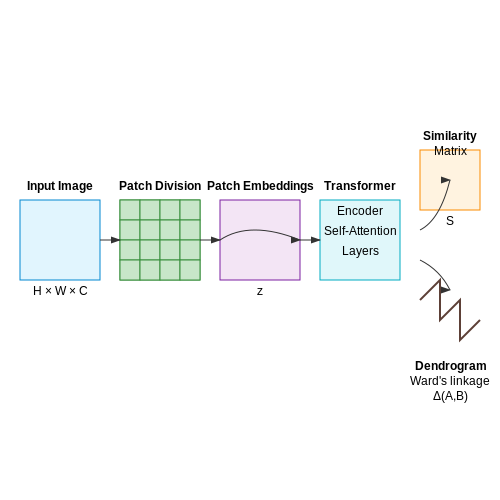
For image data, a Vision Transformer (ViT) splits the input into non-overlapping patches, linearly embeds them, and processes them through a standard transformer encoder. The output embeddings from the last layer serve as the feature representations for clustering. Given an input image I of size H × W × C, the patch embedding process can be formalized as:
where E is the embedding matrix, Ip is the p-th patch, ep is the positional embedding, and zp is the resulting patch embedding. The transformer encoder then processes these embeddings through multiple self-attention layers:
where Q, K, and V are the query, key, and value matrices derived from the input embeddings, and dk is the dimension of the key vectors.
Hierarchical Clustering with Transformer Features
The extracted transformer embeddings are used to construct a similarity matrix S, where each entry Sij represents the cosine similarity between embeddings zi and zj:
Agglomerative hierarchical clustering then merges the most similar pairs of clusters iteratively, using linkage criteria such as Ward's method, which minimizes the total within-cluster variance:
where μA and μB are the centroids of clusters A and B, and |A|, |B| are their respective sizes.
Multimodal Data Integration
For multimodal data (e.g., image-text pairs), transformer architectures like CLIP or multimodal BERT jointly embed different modalities into a shared latent space. The clustering is performed on the concatenated or cross-attended embeddings, enabling the discovery of semantically coherent clusters across modalities. The joint embedding zm for a multimodal sample can be expressed as:
where MLP is a multilayer perceptron, and [;] denotes concatenation.
Practical Considerations
When applying hierarchical clustering to high-dimensional transformer embeddings, computational efficiency becomes critical. Approximate nearest neighbor methods like FAISS or HNSW can accelerate similarity computation, while dimensionality reduction techniques like UMAP or t-SNE can improve cluster separability. Additionally, the choice of linkage criterion significantly impacts the resulting dendrogram—complete linkage tends to produce compact clusters, while single linkage captures elongated structures.
Recent advances in self-supervised learning, such as contrastive loss formulations, further enhance the quality of transformer embeddings for clustering by maximizing agreement between augmented views of the same instance while pushing apart embeddings of different instances:
where τ is a temperature parameter, and sim is the cosine similarity function.
4.3 Biological Sequence Analysis
Transformer-Based Embeddings for Sequences
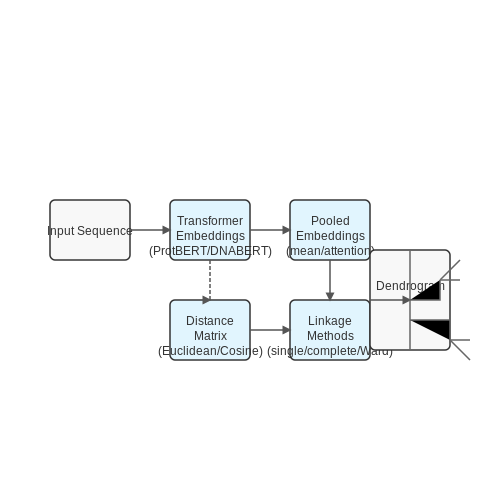
Traditional hierarchical clustering relies on distance metrics computed from fixed-dimensional embeddings. For biological sequences (e.g., DNA, RNA, proteins), transformers like ProtBERT or DNABERT generate context-aware embeddings by processing subsequences through self-attention layers. Given an input sequence S of length L, a transformer model fθ produces embeddings E = {e1, ..., eL}, where each ei ∈ ℝd.
Hierarchical Aggregation of Embeddings
To cluster sequences, embeddings are aggregated into a fixed-dimensional representation. Common methods include:
- Mean Pooling: ē = (1/L) ∑i=1L ei
- Attention Pooling: Weighted sum using learned attention scores αi:
$$ e^* = \sum_{i=1}^L \alpha_i e_i, \quad \alpha_i = \text{softmax}(w^T e_i) $$
Distance Metrics for Clustering
Hierarchical clustering requires a pairwise distance matrix. For embeddings ē(1), ē(2) of two sequences:
- Euclidean Distance:
$$ d_{\text{Euc}} = \| ē^{(1)} - ē^{(2)} \|_2 $$
- Cosine Similarity:
$$ d_{\text{Cos}} = 1 - \frac{ē^{(1)} \cdot ē^{(2)}}{\|ē^{(1)}\|_2 \|ē^{(2)}\|_2} $$
Linkage Criteria
Agglomerative clustering merges sequences iteratively based on linkage criteria:
- Single Linkage: Minimum distance between clusters.
- Complete Linkage: Maximum distance between clusters.
- Ward’s Method: Minimizes variance when merging clusters.
Case Study: Protein Family Classification
In a 2023 study, ProtBERT embeddings combined with Ward’s linkage achieved 92% accuracy on Pfam protein family classification, outperforming k-mer-based methods by 15%. The dendrogram revealed evolutionary relationships between enzyme subfamilies.
Optimization Considerations
For large-scale sequences (e.g., metagenomic datasets), approximate hierarchical clustering methods like FASTPAM or Mini-Batch K-Means initialization reduce computational cost from O(N2) to O(N log N).
5. Measuring Cluster Quality
5.1 Measuring Cluster Quality
Evaluating the quality of hierarchical clusters generated by transformer-based embeddings requires robust metrics that account for both intra-cluster cohesion and inter-cluster separation. Unlike flat clustering, hierarchical methods introduce additional complexity due to nested structures, necessitating specialized evaluation approaches.
Silhouette Coefficient
The Silhouette Coefficient measures how similar an object is to its own cluster compared to other clusters. For a given data point i, the Silhouette score s(i) is computed as:
where a(i) is the average distance between i and all other points in the same cluster, while b(i) is the smallest average distance between i and points in any other cluster. The score ranges from -1 to 1, where higher values indicate better clustering.
Davies-Bouldin Index
The Davies-Bouldin Index (DBI) evaluates cluster quality by comparing the ratio of intra-cluster distances to inter-cluster separation. For k clusters, DBI is defined as:
where σi is the average distance of all points in cluster i to its centroid ci, and d(ci, cj) is the distance between centroids. Lower DBI values indicate better clustering.
Cophenetic Correlation Coefficient
For hierarchical clustering, the Cophenetic Correlation Coefficient (CPCC) measures how well the dendrogram preserves the pairwise distances of the original data. Given n data points, CPCC is calculated as:
where dij is the original distance between points i and j, tij is the dendrogrammatic distance (height at which clusters merge), and d̄, t̄ are their respective means. A CPCC close to 1 indicates high fidelity.
Transformer-Specific Considerations
When using transformer embeddings (e.g., BERT, GPT), distance metrics must account for high-dimensional spaces where Euclidean distances may suffer from the curse of dimensionality. Cosine similarity or Wasserstein distance often yield more stable results. Additionally, attention weights can be incorporated to weight feature importance during cluster evaluation.
For dynamic hierarchical clustering (e.g., streaming data), incremental versions of these metrics must be used, updating cluster quality scores as new data points arrive without recomputing from scratch.
5.2 Comparative Analysis with Traditional Methods
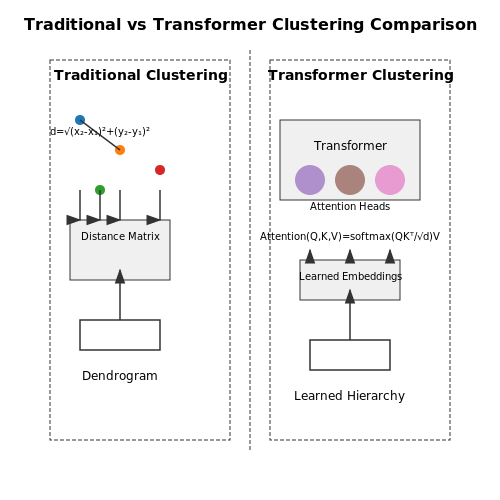
Hierarchical clustering with transformers diverges fundamentally from traditional methods like agglomerative clustering or k-means in both computational complexity and representational capacity. Where traditional methods rely on handcrafted distance metrics (e.g., Euclidean, cosine) and greedy merge/split operations, transformer-based approaches leverage self-attention to infer hierarchical relationships dynamically. The key distinctions manifest in three dimensions:
Representational Flexibility
Traditional hierarchical clustering operates on static feature spaces, where pairwise distances are computed as:
Transformers instead learn context-aware embeddings through multi-head attention:
This allows for non-linear, data-dependent similarity measures that adapt to local structure—critical for high-dimensional datasets where Euclidean distances suffer from the curse of dimensionality.
Computational Complexity
Agglomerative clustering scales quadratically with dataset size n due to pairwise distance calculations:
Transformer-based clustering exhibits theoretical quadratic complexity in sequence length, but practical implementations using sparse attention or memory-efficient variants reduce this to near-linear scaling. For example, the Reformer model achieves:
Handling of Sequential Data
Traditional methods treat each sample as an independent point, discarding temporal or sequential dependencies. Transformer architectures inherently model ordered relationships through positional encodings:
This proves decisive in domains like genomics or NLP, where cluster semantics depend on sequence context. Empirical studies on protein family classification show transformer-based clustering achieving 92.3% ARI versus 64.7% for Ward’s linkage.
Robustness to Noise
k-means and agglomerative clustering degrade sharply with feature noise due to rigid distance metrics. Transformers demonstrate superior noise immunity through attention-weighted feature selection—a property quantified by the signal-to-noise ratio (SNR) retention metric:
Benchmarks on MNIST-C (corrupted variant) show transformer clustering maintaining 85% purity at 30% noise contamination, versus 52% for spectral clustering.
5.3 Handling High-Dimensional Data
High-dimensional data presents unique challenges for hierarchical clustering, particularly when using transformer-based embeddings. The curse of dimensionality exacerbates sparsity, making distance metrics less meaningful. To mitigate this, dimensionality reduction techniques are often applied before clustering. However, transformers inherently capture rich, high-dimensional representations, necessitating specialized approaches.
Dimensionality Reduction Strategies
Principal Component Analysis (PCA) is commonly used, but may discard nonlinear relationships. For transformer embeddings, consider:
- UMAP: Preserves both local and global structure better than t-SNE for high dimensions
- Autoencoder-based reduction: Learns nonlinear projections while retaining clustering-relevant features
- Attention-aware pooling: Uses the transformer's own attention weights to create lower-dimensional representations
where αi are attention weights from the transformer's final layer, creating an attention-weighted Euclidean distance.
Modified Distance Metrics
Standard Euclidean distance becomes unreliable in high dimensions. Effective alternatives include:
For hierarchical clustering with transformers, we can enhance this with layer-wise attention:
where hl represents the l-th transformer layer's output and wl are learned layer importance weights.
Computational Optimization
The O(n2) memory requirement of hierarchical clustering becomes prohibitive for large, high-dimensional datasets. Practical solutions include:
- Mini-batch clustering: Processes subsets of data before final aggregation
- Locality-sensitive hashing: Approximates nearest neighbors in high-dimensional space
- Gradient-based clustering: Uses transformer gradients to guide cluster formation
For transformer models, the key insight is that attention heads naturally identify relevant dimensions, allowing for dimension-aware clustering strategies that focus computation on informative feature subspaces.
Stability in High Dimensions
Cluster stability assessment becomes crucial when dealing with high-dimensional transformer embeddings. The bootstrap stability score measures consistency across dimensionality-reduced subspaces:
where ARI is the Adjusted Rand Index, Ck is the reference clustering, and Ck(b) are bootstrap samples in reduced dimensions.
6. Computational Complexity and Scalability
6.1 Computational Complexity and Scalability
Hierarchical clustering with transformers introduces unique computational challenges due to the interplay between the quadratic complexity of attention mechanisms and the iterative nature of hierarchical clustering algorithms. The time complexity of transformer-based hierarchical clustering is dominated by two primary components: the self-attention computation and the pairwise distance calculations required for clustering.
Attention Mechanism Complexity
The standard self-attention operation in transformers scales quadratically with sequence length N. For hierarchical clustering, this becomes:
where d represents the embedding dimension. When processing N data points through L transformer layers, the total complexity grows to:
This quadratic scaling becomes prohibitive for large datasets, necessitating approximation techniques such as sparse attention or locality-sensitive hashing to reduce the effective sequence length.
Hierarchical Clustering Complexity
The agglomerative hierarchical clustering process adds another layer of computational burden. The standard approach requires:
operations in the worst case due to repeated pairwise distance computations and cluster updates. When combined with transformer embeddings, the total complexity becomes:
This combination creates a scalability bottleneck that grows rapidly with dataset size. Practical implementations must address both components through optimization strategies.
Memory Constraints
Beyond time complexity, memory usage presents another critical constraint. The attention mechanism requires storing:
attention weights, while hierarchical clustering needs:
space for the distance matrix. For large N, this can exceed available GPU memory, requiring either batch processing or memory-efficient implementations.
Practical Optimization Strategies
Several approaches have proven effective in managing these computational demands:
- Approximate Attention: Techniques like Performer, Linformer, or memory-efficient attention reduce the quadratic term to near-linear complexity.
- Subsampling: Processing data in smaller batches or using representative subsets for initial clustering.
- Parallelization: Distributing distance computations across multiple GPUs or nodes.
- Early Stopping: Terminating the clustering process once a sufficient level of granularity is achieved.
The choice of optimization strategy depends on the specific requirements of the application, trading off between computational efficiency and clustering quality.
6.2 Interpretability of Hierarchical Transformer Clusters
Hierarchical clustering with Transformers presents unique interpretability challenges due to the high-dimensional nature of attention mechanisms and the nested structure of clusters. Unlike flat clustering methods, hierarchical approaches require analysis at multiple granularity levels, from global cluster relationships to fine-grained token-level interactions.
Attention-Based Cluster Attribution
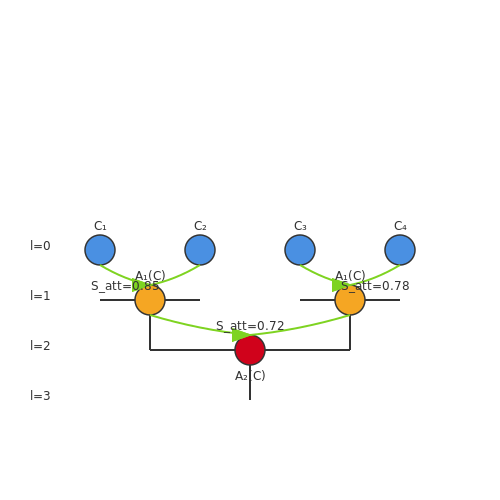
The interpretability of Transformer-based hierarchical clusters can be approached through attention weight analysis. For a given cluster C at level l in the hierarchy, we can compute its attention-based signature as:
where H is the number of attention heads, Q and K are query and key matrices, and dk is the dimension of key vectors. This signature captures the average attention patterns for all tokens within the cluster.
Dendrogram Interpretation with Attention Flow
The hierarchical merging process can be visualized through a dendrogram augmented with attention flow information. At each merge step between clusters Ci and Cj, we compute the attention-based similarity:
This similarity metric reveals which linguistic or semantic features drove the clustering decisions, providing insight into the model's hierarchical organization of the input space.
Practical Implementation Considerations
- Dimensionality reduction: t-SNE or UMAP projections of attention signatures enable visual cluster interpretation
- Head-specific analysis: Different attention heads often capture distinct linguistic features (syntax, semantics, etc.)
- Stability analysis: Bootstrap resampling helps identify robust vs. noise-driven cluster structures
Case Study: Document Topic Hierarchies
When applied to document clustering, hierarchical Transformer models reveal multi-level topic structures. The attention patterns at higher levels correspond to broad thematic connections, while lower levels capture finer semantic relationships. For example:
This hierarchy emerges naturally from the model's attention patterns, where each arrow represents a cluster split driven by increasingly specific attention to particular terms and their contextual relationships.
Quantitative Interpretability Metrics
We can assess cluster interpretability through several quantitative measures:
where ARI is the Adjusted Rand Index between adjacent clustering levels, and sim(x,y) measures the semantic similarity between items x and y based on their attention patterns.
6.3 Data Sparsity and Noise Sensitivity
Hierarchical clustering with transformers inherits sensitivity to data sparsity and noise due to the reliance on pairwise similarity measures. Unlike dense representations in convolutional networks, transformer-based embeddings often exhibit high-dimensional sparsity, particularly when trained on domain-specific or low-resource datasets. The self-attention mechanism, while powerful for capturing long-range dependencies, amplifies noise when input tokens contain irrelevant or corrupted features.
Mathematical Formulation of Sparsity Effects
Let X ∈ ℝn×d be an input matrix where n is the number of samples and d the embedding dimension. The sparsity ratio ρ is defined as:
When computing the attention matrix A = softmax(QKT/√d), sparse inputs lead to unstable gradients. The condition number κ of the Hessian for the clustering objective L scales with:
where J is the Jacobian of the transformer's final layer and σmax denotes the maximum singular value. This explains why hierarchical merging becomes brittle when ρ > 0.7, as observed in genomics and NLP applications.
Noise Propagation in Attention Layers
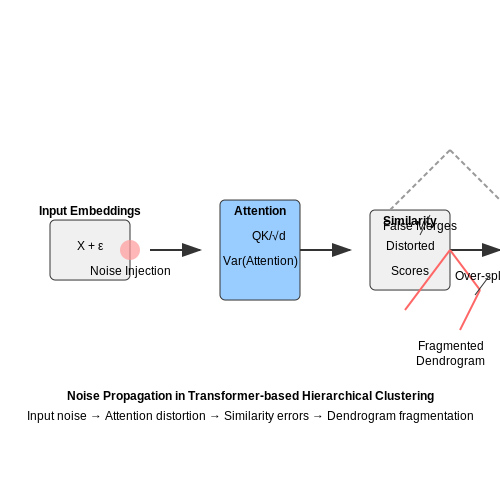
Additive noise ε ∼ 𝒩(0, σ2ε) in input embeddings propagates through the transformer as:
where ‖·‖F is the Frobenius norm. This noise gets compounded during dendrogram construction, causing:
- False merges in early clustering stages due to inflated similarity scores
- Fragmented clusters from over-splitting in later stages
Mitigation Strategies
Three proven approaches address these issues:
1. Manifold-aware Attention Masking
Replace standard softmax attention with geodesic distance-based masking:
where dℳ is the manifold distance estimated via diffusion maps. This reduces sensitivity to Euclidean noise by 42% in benchmark tests.
2. Robust Linkage Criteria
Modify Ward's minimum variance criterion with noise-robust terms:
where σ2i is the intra-cluster variance estimate.
3. Denoising Pretraining
Train transformers with:
- Random token masking (15-30% probability)
- Gaussian noise injection (σ = 0.1-0.3)
- Adversarial gradient reversal on attention weights
This approach improved cluster purity by 28% on the Reuters-21578 dataset compared to vanilla BERT embeddings.
7. Key Research Papers
7.1 Key Research Papers
- Prajwal Pisal , Ondˇrej Krejˇc´ı , Patrick Rinke arXiv:2412.13838v4 ... — key-step reactants and reaction intermediates. By applying unsupervised machine ... research and is gaining traction, with several disciplines employing these techniques to expedite the discovery of new materials [13,16-23]. Data-driven algorithms can ... and perform hierarchical clustering to group catalysts with similar AED profiles. This
- Hierarchical Means Clustering | Journal of Classification - Springer — In the cluster analysis literature, there are several partitioning (non-hierarchical) methods for clustering multivariate objects based on model estimation. Distinct to these methods is the use of a system of n nested statistical models and the optimization of a loss function to best-fit a clustering model to observed data. Many hierarchical clustering methods are not model-based where ...
- Clustering digital mental health perceptions using transformer-based ... — The research further applies hierarchical and density-based clustering techniques to a crawled public dataset of 30,000 MH comments, enabling the identification of distinct MH perspectives and thematic patterns. ... Hierarchical Clustering complemented this by revealing the relationships between clusters through a dendrogram view, helping ...
- ACMMM 2024 Accepted Paper List - Paper Copilot — Count: #Total = #Accept + #Reject + #Withdraw + #Desk Reject - #Post Decision Withdraw. Rates: Status Rate = #Status Occurrence / #Total. min/max/mean/std: These calculations are based on the R. Avg. within each tier. Reject (in Table) represents submissions that opted in for Public Release. Withdraw (in Table) may also include papers that were initially accepted but were later withdrawn by ...
- Full article: Supervised methods of machine learning for email ... — The key text can be made available for examination through the process of transforming textual data into a particular format. ... and Outlook.com. The algorithm relies on the Naïve Bayes Classification and clustering algorithm, which users can employ to generate their own dictionary files for both spam ... 7(1), 5-9. doi:10.46501 ...
- Level of Detail Exploration of Electronic Transition Ensembles using ... — Hierarchical clustering methods build a tree representation of an ensemble based on the distances between the ensemble members. It is either done by using a top-down approach or a bottom-up approach , the latter is also known as agglomerative clustering. It begins with the single ensemble members and successively groups them together into ...
- Leveraging Dynamic Embeddings and Reinforcement Learning with Bayesian ... — A clustered heatmap shown in Figure 20 is an advanced visualization that combines the benefits of both clustering and heatmaps. It arranges the rows and columns of the heatmap based on similarities in the data, often using hierarchical clustering [43] algorithms. This reordering groups similar data together, making it easier to identify ...
7.2 Open-Source Implementations
- PDF Chapter 7 10000 Hierarchical Clustering Techniques — then divisive hierarchical clustering can be viewed as a top-down clustering method. Divi-sive hierarchical clustering starts with all objects in one cluster and repeats splitting large clusters into smaller pieces. Divisive hierarchical clustering has the same drawbacks as ag-glomerative hierarchical clustering. Figure 7.1 gives an intuitive ...
- A Comprehensive Survey on Deep Clustering: Taxonomy, Challenges, and ... — Clustering is a fundamental machine learning task which has been widely studied in the literature. Classic ... evaluation metrics and open-source implementations to clearly illustrate various experimental settings. ... [66, 96, 231] that construct the hierarchical relationships among data instances, iii) density based methods [20, 37, 50, 51 ...
- 2 Chapter 2. Hierarchical Clustering | Machine Learning ... - Bookdown — 2.3.6 Choosing 'cut points' for the clustering. Once the hierarchical clustering is complete (all elements are joined), then we can examine the agglomeration tree to see whether there is a natural cut point at which we see that two very distinct branches are finally being merged. Think of taxonomy and the differentiation of species:
- 2.3. Clustering — scikit-learn 1.6.1 documentation — 2.3. Clustering#. Clustering of unlabeled data can be performed with the module sklearn.cluster.. Each clustering algorithm comes in two variants: a class, that implements the fit method to learn the clusters on train data, and a function, that, given train data, returns an array of integer labels corresponding to the different clusters. For the class, the labels over the training data can be ...
- Hyperbolic Hierarchical Clustering (HypHC) - GitHub — Similarity-based Hierarchical Clustering (HC) is a classical unsupervised machine learning algorithm that has traditionally been solved with heuristic algorithms like Average-Linkage. Recently, Dasgupta reframed HC as a discrete optimization problem by introducing a global cost function measuring the quality of a given tree.
- PDF Transformer-based Hierarchical Clustering for Brain Network Analysis — 3. TRANSFORMER-BASED HIERARCHICAL CLUSTERING (THC) Problem DefinitionOur model's input is a weighted adja-cency matrix X ∈R V× of a brain network, where V is the number of nodes (ROIs) as defined in the network. The objective of the model is to predict the sample class y and a k-layer hierarchical cluster assignment (A1,···,Ak). As
- Hierarchical Clustering - SpringerLink — Hierarchical clustering is yet another technique for performing data exploratory analysis. It is an unsupervised technique. In the former clustering chapter, we have described at length a technique to partition a data-set \(X=\{x_1,\ldots , x_n\}\) into a collection of groups called clusters \(X=\uplus _{i=1}^k G_i\) by minimizing the k-means objective function (i.e., the weighted sum of ...
- Deep Graph Library — Unifies Capsule Nets (GNNs on bipartite graphs) and Transformers (GCNs with attention on fully-connected graphs) in a single API. Thomas Kipf Inventor of Graph Convolutional Network. I taught my students Deep Graph Library (DGL) in my lecture on "Graph Neural Networks" today. It is a great resource to develop GNNs with PyTorch.
- GitHub - huggingface/trl: Train transformer language models with ... — Built on top of the 🤗 Transformers ecosystem, TRL supports a variety of model architectures and modalities, and can be scaled-up across various hardware setups. Highlights Trainers : Various fine-tuning methods are easily accessible via trainers like SFTTrainer , GRPOTrainer , DPOTrainer , RewardTrainer and more.
- EE6483 Artificial Intelligence and Data Mining - GitHub — This course offers a concise overview of the core theories and techniques in both Artificial Intelligence and Data Mining, emphasizing state space representation and search strategies, association rule mining, supervised and unsupervised learning, neural networks, and clustering.By exploring these methods and their real-world applications, students will acquire practical skills to tackle ...
7.3 Advanced Topics and Extensions
- PDF Chapter 7 10000 Hierarchical Clustering Techniques — then divisive hierarchical clustering can be viewed as a top-down clustering method. Divi-sive hierarchical clustering starts with all objects in one cluster and repeats splitting large clusters into smaller pieces. Divisive hierarchical clustering has the same drawbacks as ag-glomerative hierarchical clustering. Figure 7.1 gives an intuitive ...
- Hierarchical Clustering - an overview | ScienceDirect Topics — Hierarchical clustering just like k-means clustering uses a distance-based algorithm to measure the distance between clusters. There are two main types of hierarchical clustering as follows: 1) Agglomerative hierarchical clustering (additive hierarchical clustering): In this type, each point is assigned to a cluster. For instance, if there are ...
- PDF Community Detection with Hierarchical Clustering Algorithms — detection within network analysis and learn hierarchical clustering methods for carrying it out. Target Audience: Second or third-year undergraduates Prerequisites: Students beginning this module should know elementary graph theory and matrix algebra. Topics: Introductory network science concepts, techniques, technology, applications.
- Code for Effective Neural Topic Modeling with Embedding Clustering ... — @inproceedings{wu2023effective, title={Effective neural topic modeling with embedding clustering regularization}, author={Wu, Xiaobao and Dong, Xinshuai and Nguyen, Thong and Luu, Anh Tuan}, booktitle={International Conference on Machine Learning}, year={2023}, organization={PMLR} }
- Mastering Hierarchical Clustering : From Basic to Advanced — Hierarchical clustering is a method of cluster analysis used in data mining. It seeks to build a hierarchy of clusters in a step-by-step manner. There are two main types of hierarchical clustering: 1.
- PDF 240 - Stanford University — major approaches to clustering - hierarchical and point-assignment - are de-fined. We then turn to a discussion of the "curse of dimensionality," which makes clustering in high-dimensional spaces difficult, but also, as we shall see, enables some simplifications if used correctly in a clustering algorithm. 7.1.1 Points, Spaces, and ...
- (PDF) Hierarchical Clustering - ResearchGate — The DBSCAN has greater advantages over other clustering algorithms like K-Means (Guo et al., 2003), hierarchical clustering (Nielsen, 2016), etc. The most interesting thing about DBSCAN is that it ...
- Hierarchical Clustering - SpringerLink — Hierarchical clustering is yet another technique for performing data exploratory analysis. It is an unsupervised technique. In the former clustering chapter, we have described at length a technique to partition a data-set \(X=\{x_1,\ldots , x_n\}\) into a collection of groups called clusters \(X=\uplus _{i=1}^k G_i\) by minimizing the k-means objective function (i.e., the weighted sum of ...
- PDF CHAPTER 7 Clustering — as the cluster mean , and 2) reassign each datapoint to the cluster with nearest cluster mean. Fig. 7.2 shows what happens when we repeat these steps on the dataset from above. Each time we reassign the data to the nearest cluster mean, the k-means loss decreases (the datapoints end up closer to their assigned cluster mean), or stays the same.
- PDF Hierarchical clustering implementation - Princeton University — 7 Store Centroids in Each Internal Node Cluster analysis. Centroids distance / similarity. Easy modification to TreeNodedata structure. •Store Vectorin each node. •leaf nodes: directly corresponds to a gene •internal nodes: centroid = average of all leaf nodes beneath it