


HOW TO make a cheap narrowband A/F gauge
#oxygen sensor
#air/fuel ratio
#engine management
#voltage measurement
#exhaust system
#narrowband
#sensor circuit
#automotive diagnostics
#O2 sensor
#fuel efficiency

Description: The engine management system monitors its air-fuel ratio using an oxygen sensor (O2) located in the hot exhaust flow, typically positioned before the catalytic converter. All O2 sensors function similarly, with variations including heated sensors or those with multiple signal lines. An O2 sensor produces a voltage output ranging from 0 to 1 volt, where a reading of 0 volts indicates a lean condition and a reading of 1 volt signifies a rich condition. Various manufacturers, such as Autometer, Cyberdyne, and Intellitronix, produce air-fuel gauges priced at $30 or more, likely utilizing the same driver chip for display illumination. The primary distinction among these gauges is likely the display resolution, which may be adjustable. This information is intended for individuals interested in creating a cost-effective air-fuel meter. It is essential to read the entire procedure before commencing the project, as any resulting damage or injury is the sole responsibility of the individual. Basic soldering skills are required, and caution should be exercised when soldering the driver chip directly to avoid overheating and damaging it. The DIY gauge can be aesthetically integrated into the dashboard or cluster; however, leaving it exposed may detract from the overall appearance. The estimated total cost for this project is approximately $10, or around $4 if some parts are sourced for free. Familiarity with engine tuning, engine management wiring, and general electrical principles is recommended, along with reference materials such as a Bentley manual. Using chip sockets is advisable for ease of assembly and to minimize potential errors, although they are not mandatory. Care should be taken to avoid reversing pins when soldering. Soldering wires from the chip to the LED socket allows for flexible placement of the LED display. It is important to note that LEDs have a designated positive and negative orientation, indicated by a flat spot on the bar graph chip for pin 1. Various methods can ensure a well-executed project, including terminating wires with connectors. Floppy drive ribbon cables can facilitate neat connections among circuits, allowing for separate mounting of the LED graph. While most users prefer a wideband O2 measurement from 0 to 1 volt, some may require finer resolution, measuring from 0.4 to 1 volt, where the first LED corresponds to approximately 0.4 volts and the tenth LED to 1 volt. Engines with turbochargers, superchargers, or nitrous systems may necessitate finer resolution due to critical air-fuel ratio requirements. In naturally aspirated engines, finer resolution may be less critical since the optimal mixture (14.7:1) corresponds to around 0.5 volts from the O2 sensor. Resistor R1 determines the LED display resolution, while resistor R2 controls the LED brightness. Potentiometers can replace these resistors to allow for fine-tuning of both the bar graph resolution and display brightness. If utilizing a potentiometer, an ohmmeter should be used to measure resistance in the range of 2.3k to 3.3k ohms, providing adjustability for future modifications.
The design of this air-fuel gauge project involves several key components and considerations to ensure optimal performance and reliability. The oxygen sensor serves as the primary input device, providing real-time feedback on the air-fuel mixture by converting the exhaust gas composition into a corresponding voltage signal. This voltage signal is then processed by the driver chip, which translates the input into a visual representation on the LED bar graph.
The LED display is configured to reflect the air-fuel ratio, where each LED corresponds to a specific voltage range. The use of resistors R1 and R2 is crucial in defining both the resolution of the display and the brightness of the LEDs. By selecting appropriate resistor values, the sensitivity of the gauge can be tailored to suit specific engine configurations and performance requirements.
Incorporating potentiometers in place of fixed resistors allows for dynamic adjustments to the display characteristics, accommodating various tuning needs. This feature is particularly beneficial for performance engines that demand precise monitoring of the air-fuel mixture under different operating conditions.
The assembly process requires careful attention to detail, particularly during soldering operations. Using chip sockets can simplify the installation and replacement of components, reducing the risk of damage due to overheating. Proper orientation of the LEDs is essential to ensure correct functionality, as incorrect installation can lead to display failures.
For enhanced organization and ease of installation, utilizing ribbon cables for connections can streamline the wiring process, minimizing clutter and facilitating maintenance. This approach not only improves the aesthetic appeal of the installation but also enhances the overall durability of the connections.
In conclusion, this DIY air-fuel gauge project offers an accessible solution for monitoring engine performance, with the potential for customization to meet individual needs. By leveraging common electronic components and adhering to best practices in assembly and design, users can create an effective tool for optimizing engine tuning and performance.The way an engine management system monitors its Air / Fuel ratio is through the Oxygen Sensor (O2) stuck in the hot exhaust flow, usually before the catalytic converter. All O2 sensors are basically the same, with some being heated or others providing multiple signal lines.
An O2 sensor generates a voltage from 0-1Volt. A reading of 0 volts describes a LEAN condition, while a reading of 1 volt descrigbes a RICH condition. Autometer, Cyberdyne, Intellitronix, and many others manufacter A/F Gauges costing at least $30 or more. It is almost a certainty that all of those gauges uses the exact same driver chip to light up their display.
The only difference between the gauges will probably be the resolution of the display, which should be adjustable. This is for people who would like to create an inexpensive Air / Fuel meter. PLEASE read this entire procedure before taking this project on. No one but you is responsible if you burn yourself or screw up your car in anyway. Basic soldering skills are a necessity. If you decide to solder the driver chip directly, DO NOT leave the soldering iron on the chip to long as the heat will destroy the chip fairly quickly.
This DIY gauge can look pretty nice as you can carve out a little section in your cluster or dash and put the bargraph in there. but if you leave it dangling out, it doesn`t look pretty. Total cost: for this project is ~$10 bucks. ~$4 bucks if you manage to obtain some parts for free. No responsibility is taken if you break something while trying to execute this procedure. You should be familiar with engine tuning, engine management wiring, and electricity in general. A Bentley manual will also come in very handy. Chip sockets should probably be used as it is easier and there are fewer things that could go wrong. You don`t have to though. but make sure when you use the sockets that you don`t get the pins reversed when soldering. You can also un-solder the sockets out of old electronics or mother boards if you need some quickly. If you solder a bunch of wires from the chip to the LED socket you can have some placement flexibility for the LED display.
Be aware that LED`s only work one way. they have a Positive side and Negative side. There`s a flat spot in the corner of the bargraph `chip` to indicate Pin 1. There are many differant ways to make this a clean well executed project, but as always, the end result if from your own efforts. Such niceities as terminating the wires with connectors and what not. you can also use floppy drive ribbon cables to connect all the circuits together, which will make it easy and neat to mount the LED graph separately.
Most people want the wide band of the O2 measuring from 0-1v. But some might want a Finer Resolution. Where it`ll measure from 0. 4-1v. This would mean that the 1st LED will be ~0. 4v and the 10th LED will be 1v. Engines equipped with a turbo, blowers, or Nitrous, might want a finer resolution as the Air / Fuel ratio is especially critical for those motors. In a Naturally Asperated engine, the finer resolution might not be necessary as the proper mixture (14.
7:1) is at about 0. 5v from the O2 sensor. Resistor R1 is what determines the resolution for the LED display. Resistor R2 is what determines the relative brightness of the LED. You can stick potentiometers in place of these resistors in order to fine tune the bar graph resolution and display brightness. If you decide to use the Potentiometer (POT) you need to get a Ohm meter and measure the range at which resistance ranges from 2.
3k to 3. 3k. As it is adjustable, you can change it later. In order to r
The design of this air-fuel gauge project involves several key components and considerations to ensure optimal performance and reliability. The oxygen sensor serves as the primary input device, providing real-time feedback on the air-fuel mixture by converting the exhaust gas composition into a corresponding voltage signal. This voltage signal is then processed by the driver chip, which translates the input into a visual representation on the LED bar graph.
The LED display is configured to reflect the air-fuel ratio, where each LED corresponds to a specific voltage range. The use of resistors R1 and R2 is crucial in defining both the resolution of the display and the brightness of the LEDs. By selecting appropriate resistor values, the sensitivity of the gauge can be tailored to suit specific engine configurations and performance requirements.
Incorporating potentiometers in place of fixed resistors allows for dynamic adjustments to the display characteristics, accommodating various tuning needs. This feature is particularly beneficial for performance engines that demand precise monitoring of the air-fuel mixture under different operating conditions.
The assembly process requires careful attention to detail, particularly during soldering operations. Using chip sockets can simplify the installation and replacement of components, reducing the risk of damage due to overheating. Proper orientation of the LEDs is essential to ensure correct functionality, as incorrect installation can lead to display failures.
For enhanced organization and ease of installation, utilizing ribbon cables for connections can streamline the wiring process, minimizing clutter and facilitating maintenance. This approach not only improves the aesthetic appeal of the installation but also enhances the overall durability of the connections.
In conclusion, this DIY air-fuel gauge project offers an accessible solution for monitoring engine performance, with the potential for customization to meet individual needs. By leveraging common electronic components and adhering to best practices in assembly and design, users can create an effective tool for optimizing engine tuning and performance.The way an engine management system monitors its Air / Fuel ratio is through the Oxygen Sensor (O2) stuck in the hot exhaust flow, usually before the catalytic converter. All O2 sensors are basically the same, with some being heated or others providing multiple signal lines.
An O2 sensor generates a voltage from 0-1Volt. A reading of 0 volts describes a LEAN condition, while a reading of 1 volt descrigbes a RICH condition. Autometer, Cyberdyne, Intellitronix, and many others manufacter A/F Gauges costing at least $30 or more. It is almost a certainty that all of those gauges uses the exact same driver chip to light up their display.
The only difference between the gauges will probably be the resolution of the display, which should be adjustable. This is for people who would like to create an inexpensive Air / Fuel meter. PLEASE read this entire procedure before taking this project on. No one but you is responsible if you burn yourself or screw up your car in anyway. Basic soldering skills are a necessity. If you decide to solder the driver chip directly, DO NOT leave the soldering iron on the chip to long as the heat will destroy the chip fairly quickly.
This DIY gauge can look pretty nice as you can carve out a little section in your cluster or dash and put the bargraph in there. but if you leave it dangling out, it doesn`t look pretty. Total cost: for this project is ~$10 bucks. ~$4 bucks if you manage to obtain some parts for free. No responsibility is taken if you break something while trying to execute this procedure. You should be familiar with engine tuning, engine management wiring, and electricity in general. A Bentley manual will also come in very handy. Chip sockets should probably be used as it is easier and there are fewer things that could go wrong. You don`t have to though. but make sure when you use the sockets that you don`t get the pins reversed when soldering. You can also un-solder the sockets out of old electronics or mother boards if you need some quickly. If you solder a bunch of wires from the chip to the LED socket you can have some placement flexibility for the LED display.
Be aware that LED`s only work one way. they have a Positive side and Negative side. There`s a flat spot in the corner of the bargraph `chip` to indicate Pin 1. There are many differant ways to make this a clean well executed project, but as always, the end result if from your own efforts. Such niceities as terminating the wires with connectors and what not. you can also use floppy drive ribbon cables to connect all the circuits together, which will make it easy and neat to mount the LED graph separately.
Most people want the wide band of the O2 measuring from 0-1v. But some might want a Finer Resolution. Where it`ll measure from 0. 4-1v. This would mean that the 1st LED will be ~0. 4v and the 10th LED will be 1v. Engines equipped with a turbo, blowers, or Nitrous, might want a finer resolution as the Air / Fuel ratio is especially critical for those motors. In a Naturally Asperated engine, the finer resolution might not be necessary as the proper mixture (14.
7:1) is at about 0. 5v from the O2 sensor. Resistor R1 is what determines the resolution for the LED display. Resistor R2 is what determines the relative brightness of the LED. You can stick potentiometers in place of these resistors in order to fine tune the bar graph resolution and display brightness. If you decide to use the Potentiometer (POT) you need to get a Ohm meter and measure the range at which resistance ranges from 2.
3k to 3. 3k. As it is adjustable, you can change it later. In order to r

Wearable hypoxia monitoring circuit design
The circuit principle involves an oxygen sensor circuit utilizing the OS-12, a DC amplifier IC1, an A/D converter IC4, a liquid crystal display F2100-34PI, a voltage comparator IC2, and a positive and negative power converter IC, among other components. The...

EIGHT CHANNEL COMPUTERIZED 3SUP1 SUP SUB2 SUB DIGIT_VM
Displays up to eight different DC voltages on a CRT terminal of a microprocessor under keyboard control, using BASIC commands and a BASIC routine provided in the article. Utilizes a modified Motorola MC14433 dual-lamp integrating analog-to-digital converter. An unknown voltage...
EIGHT CHANNEL COMPUTERIZED 3SUP1 SUP SUB2 SUB DIGIT_VM
Displays up to eight different DC voltages on a CRT terminal of a microprocessor under keyboard control, using BASIC commands and a BASIC routine provided in the article. Utilizes a modified Motorola MC14433 dual-lamp integrating analog-to-digital converter. An unknown voltage...

Test-Measurement 4
In circuit diagrams provided in equipment manuals, voltages at various points in the circuit are typically indicated. A deviation from these specified values suggests that a component has failed and can help in identifying faulty areas. Specifications include: D.C. Voltage...
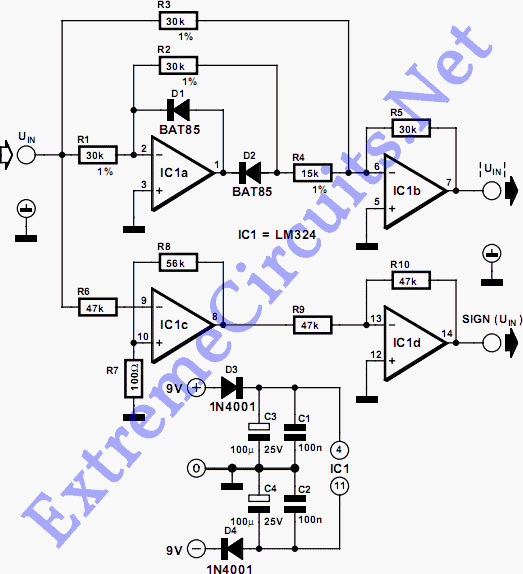
Absolute-Value Meter With Polarity Detector
This circuit separates an input voltage signal into its components: (1) the absolute value and (2) the polarity or 'sign' (+ or -). It is designed to handle direct current (DC) signals.
The circuit operates by utilizing operational amplifiers (op-amps) to...
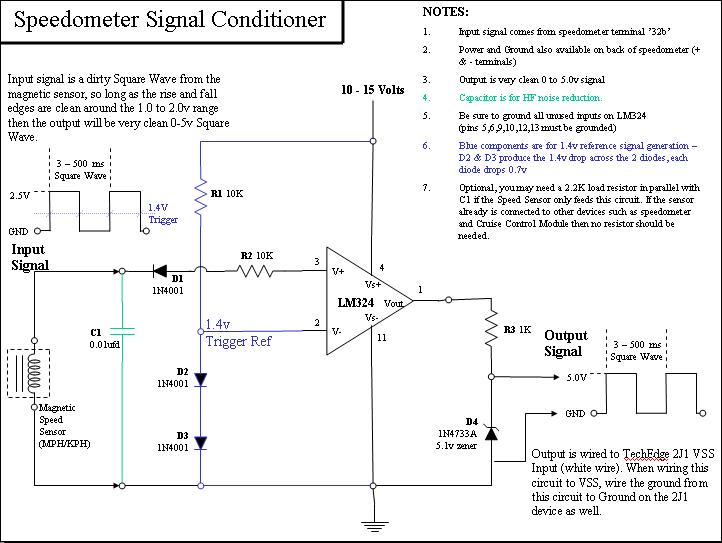
Wide Band O2 and data logger for 84-89 Carrera
Sal, thank you for the response. If the plugs could be acquired and the signals transmitted to the PC using the software you are utilizing...
The circuit design involves the integration of plugs that can be connected to a signal source,...

o2 sensor
The oxygen sensor simulator is constructed on a protoboard. It utilizes a cigarette lighter plug as the power source. An adjustment knob is located on the left side, while a switch is positioned on the right. A red indicator LED...

muffler valves dual-mode exhaust not opening at 3500rpm
A peculiar issue has arisen over the past few months regarding the stock muffler flaps and valves, which are not opening at any RPM, including above 3500 RPM. They do not appear to be stuck, as they operate correctly when...

oxygen sensor tester circuit board
A 12V power supply is connected to the positive terminal, allowing current to flow through a protection diode and a capacitor that smooths the voltage. A zener resistor (R5) limits the current to the zener diode, which regulates the voltage...