

Using Clamp Meters
1. What is a Clamp Meter?
1.1 What is a Clamp Meter?
A clamp meter, also known as a current clamp or tong tester, is an electrical test instrument that measures current without requiring physical contact with the conductor. Unlike conventional multimeters, which necessitate breaking the circuit to insert the meter in series, a clamp meter measures current inductively by detecting the magnetic field generated around a current-carrying conductor.
Operating Principle
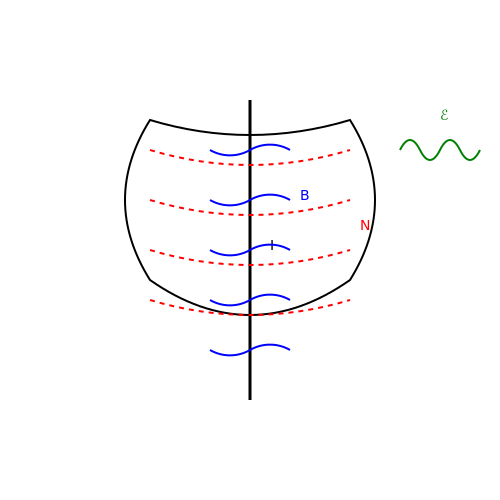
The fundamental operation of a clamp meter is based on Faraday’s Law of Induction and Ampère’s Circuital Law. When alternating current (AC) flows through a conductor, it generates a time-varying magnetic field proportional to the current. The clamp meter’s iron-core jaws concentrate this magnetic field, inducing a voltage in a coil wrapped around the core. This induced voltage is then processed to determine the current magnitude.
where ℰ is the induced electromotive force (EMF), N is the number of coil turns, and dΦB/dt is the rate of change of magnetic flux. For a sinusoidal AC current I(t) = I0 sin(ωt), the induced EMF becomes:
where μ0 is the permeability of free space, A is the cross-sectional area of the magnetic core, and ω is the angular frequency of the AC signal.
Key Components
- Jaws: Ferromagnetic core that concentrates the magnetic field around the conductor.
- Hall Effect Sensor (for DC measurements): Detects the magnetic field from DC currents by producing a voltage proportional to the field strength.
- Current Transformer (for AC measurements): Steps down the induced current for measurement.
- Signal Conditioning Circuitry: Amplifies and filters the detected signal for accurate readings.
- Digital/Analog Display: Presents the measured current in amperes (A) or milliamperes (mA).
Types of Clamp Meters
AC Clamp Meters
Designed for alternating current measurements, these meters rely on electromagnetic induction and are incapable of measuring DC currents. They are commonly used in power distribution systems, motor diagnostics, and HVAC applications.
DC Clamp Meters
Utilize Hall Effect sensors to measure both AC and DC currents. The Hall sensor generates a voltage when exposed to a magnetic field, enabling DC current measurement. These are essential in automotive, battery testing, and renewable energy systems.
Power Clamp Meters
Combine voltage and current measurement capabilities to compute real power (W), reactive power (VAR), and apparent power (VA) in electrical systems. They often include power factor calculation and harmonic analysis features.
Practical Applications
- High-Current Measurements: Safely measure currents in industrial machinery without interrupting the circuit.
- Energy Audits: Monitor power consumption in commercial and residential buildings.
- Troubleshooting: Diagnose faults in electrical panels, transformers, and motor drives.
- Renewable Energy Systems: Assess performance in solar inverters and wind turbine generators.
Advantages Over Conventional Multimeters
- Non-Invasive Measurement: Eliminates the need to disconnect wires, reducing downtime and risk.
- Higher Current Range: Capable of measuring hundreds or thousands of amperes, unlike most multimeters.
- Enhanced Safety: Minimizes exposure to live conductors, reducing electrical shock hazards.
Limitations
- Accuracy Dependency: Sensitive to conductor positioning and external magnetic fields.
- Limited Resolution: Typically less precise than shunt-based measurements for low currents.
- Frequency Response: Some models may struggle with high-frequency or distorted waveforms.
Key Components and Features
Current Transformer (CT) Core
The clamp meter's core component is a split-core current transformer, enabling non-contact current measurement. The core consists of high-permeability ferromagnetic material (e.g., silicon steel or nanocrystalline alloys) with a typical relative permeability (μr) exceeding 10,000. The magnetic flux density (B) induced by the conductor current (I) follows:
where r is the radial distance from the conductor. The split-core design introduces an air gap when opened, affecting the magnetic circuit's reluctance (Rm):
where lc and lg are core and gap lengths, and Ac, Ag are cross-sectional areas.
Hall Effect Sensor (DC Measurement)
For DC and AC+DC measurements, a Hall-effect sensor is integrated into the core gap. The sensor output voltage (VH) is proportional to the perpendicular magnetic field (B⊥):
where KH is the sensor sensitivity (typically 50–200 mV/mT) and IC is the control current. Temperature drift compensation is critical, achieved via on-chip thermistors or differential sensor configurations.
Signal Conditioning Circuitry
The raw sensor output undergoes:
- Amplification: Instrumentation amplifiers with CMRR > 100 dB reject common-mode noise.
- Filtering: 2nd-order active anti-aliasing filters with cutoff frequencies tailored to the measurement bandwidth (e.g., 1 kHz for power systems).
- Analog-to-Digital Conversion: 16–24 bit Σ-Δ ADCs provide resolution down to 1 mA for high-end models.
True-RMS Conversion
Advanced clamp meters compute True-RMS values using dedicated ICs (e.g., AD8436) or digital signal processing. For a periodic signal i(t) with period T:
This is essential for distorted waveforms (THD > 10%), where average-responding meters exhibit errors exceeding 40%.
Safety and Isolation
Clamp meters comply with IEC 61010-1 CAT III/CAT IV standards, featuring:
- Double-insulated test leads
- Creepage distances ≥ 5 mm for 600V ratings
- Current-limiting fuses (HRC type) for mA/uA ranges
Wireless and Data Logging
High-end models integrate Bluetooth/Wi-Fi for real-time data streaming, with sampling rates up to 10 kS/s. Data formats (CSV, MODBUS) enable integration with LabVIEW or Python analysis scripts.
1.3 Advantages Over Traditional Multimeters
Non-Invasive Current Measurement
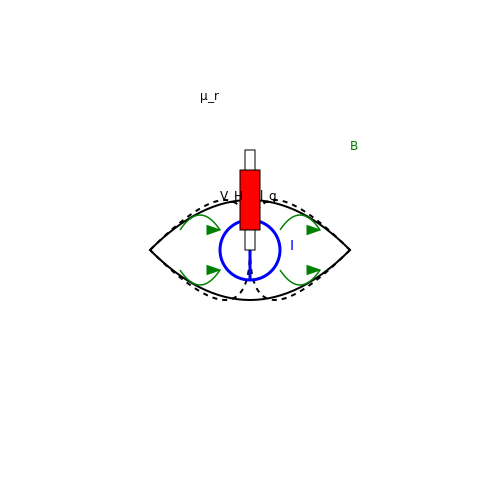
Clamp meters measure current without breaking the circuit, unlike traditional multimeters that require series connections. This is achieved through a Hall-effect sensor or current transformer (CT) mechanism, detecting the magnetic field generated by the conductor. The induced current Iclamp is proportional to the primary current Ip:
where k is the clamp's turns ratio. This eliminates the need for physical contact with live conductors, reducing downtime and shock risks.
High-Current Capability
Traditional multimeters typically max out at 10–20 A due to shunt resistor limitations. Clamp meters, however, can measure hundreds to thousands of amperes by leveraging the CT principle. For example, a 1000:1 CT-based clamp scales a 1000 A primary current to a 1 A secondary current, measurable by internal circuitry.
Dynamic Load Analysis
Clamp meters excel in capturing inrush currents and transient loads. Their bandwidth (typically 1–100 kHz) surpasses most multimeters (0.1–1 kHz), enabling analysis of:
- Motor startup currents
- Switching power supply harmonics
- Arc fault signatures
Safety and Isolation
The clamp's insulated jaw provides galvanic isolation from high-voltage systems. Traditional multimeters require direct contact, increasing arc flash risks. For a 480 VAC system, the clamp meter’s isolation voltage (typically 600–1000 V) ensures operator safety during current measurements.
Phase-Current Measurements
Three-phase systems benefit from clamp meters’ ability to measure individual phase currents simultaneously using multiple clamps. Traditional multimeters necessitate sequential measurements, introducing phase-angle errors. The real power P in a balanced three-phase system is derived as:
where VLL is line-to-line voltage and φ is the phase angle.
Harmonic Analysis
Advanced clamp meters integrate Fast Fourier Transform (FFT) capabilities to quantify harmonic distortion. Unlike RMS-only multimeters, they decompose current waveforms into spectral components, critical for:
- THD (Total Harmonic Distortion) assessment
- Identifying non-linear loads (e.g., VFDs, LED drivers)
- Compliance with IEEE 519-2014 standards
2. Magnetic Induction and Current Measurement
2.1 Magnetic Induction and Current Measurement
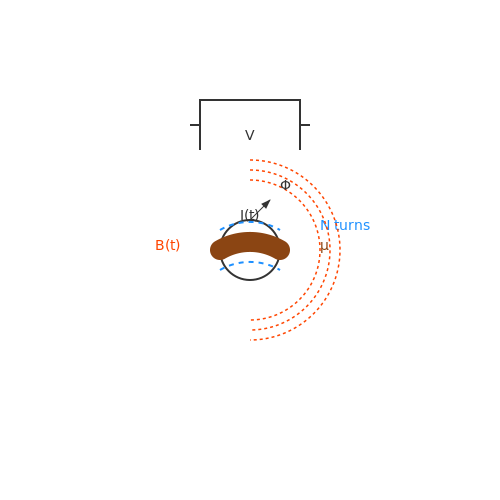
The operation of clamp meters relies fundamentally on Faraday's Law of Induction, which relates the time-varying magnetic field generated by a current-carrying conductor to the induced electromotive force (EMF) in a sensing coil. When a conductor carries an alternating current I(t), it produces a circumferential magnetic field B(t) whose magnitude is governed by Ampère's Law:
where μ0 is the permeability of free space and Ienc is the enclosed current. The clamp meter's ferromagnetic core concentrates this field, enhancing flux linkage with the secondary winding.
Induced Voltage Derivation
For a sinusoidal current I(t) = Ipsin(ωt), the magnetic flux Φ through an N-turn coil becomes:
where μr is the relative permeability of the core, A is the cross-sectional area, and r is the effective magnetic path radius. The induced EMF follows from Faraday's Law:
This voltage is proportional to both the current frequency ω and amplitude Ip, necessitating frequency compensation in wideband measurements.
Practical Implementation Challenges
Real-world clamp meters must account for:
- Core saturation: Nonlinear B-H curves limit measurable current ranges
- Phase shift: Eddy currents introduce a lag between primary current and secondary voltage
- DC immunity: Pure DC currents require Hall-effect sensors rather than induction
Modern solutions employ:
- Permalloy cores for high permeability with low hysteresis
- Active integrator circuits to recover the original current waveform
- Hybrid Hall-effect/induction designs for DC-AC capability
High-Frequency Considerations
At frequencies above 1 kHz, skin effect and parasitic capacitance introduce measurement errors. The transfer impedance Zt of the clamp becomes frequency-dependent:
where σ is the core conductivity. This necessitates calibration curves for RF current measurements.
2.2 AC vs. DC Measurement Capabilities
Fundamental Differences in Measurement Principles
Clamp meters measure current by detecting the magnetic field generated around a conductor. The underlying physics differs significantly between alternating current (AC) and direct current (DC). For AC measurements, Faraday's law of induction dominates, where a time-varying magnetic field induces a voltage in the clamp's coil:
where N is the number of turns in the coil and ΦB is the magnetic flux. In contrast, DC measurement requires Hall-effect sensors, as a constant current produces a static magnetic field that cannot induce voltage in a coil. The Hall voltage VH is given by:
where IB is the bias current, B the magnetic field strength, n the charge carrier density, e the electron charge, and t the thickness of the Hall element.
Sensor Technologies and Their Limitations
Modern clamp meters typically employ one of three sensor configurations:
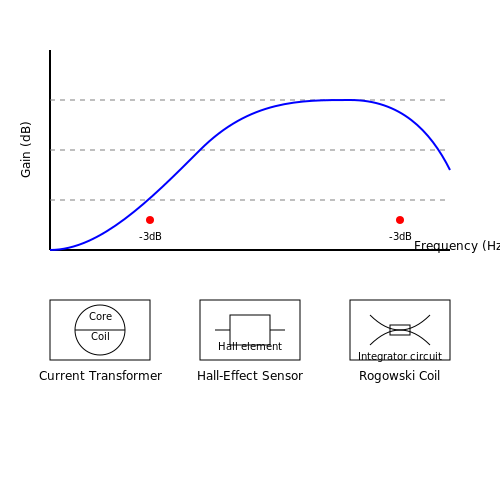
- Current transformer (AC-only): Limited to frequencies typically between 50Hz-1kHz, with accuracy degrading at higher frequencies due to parasitic capacitance and core losses.
- Hall-effect sensor (DC/low-frequency AC): Can measure DC but suffers from temperature drift and requires periodic zeroing. Bandwidth typically limited to 100kHz.
- Rogowski coil (high-frequency AC): Linear output but requires integration of the measured signal, making it unsuitable for DC. Frequency response can extend to several MHz.
Waveform Considerations and Measurement Accuracy
True-RMS clamp meters use thermal or computational methods to accurately measure non-sinusoidal waveforms. For a distorted current waveform i(t) containing harmonics, the RMS value is calculated as:
Average-responding meters, while less expensive, can exhibit errors exceeding 40% when measuring non-sinusoidal waveforms. For DC measurements, the primary error sources include:
- Hall sensor offset voltage (typically 0.5-5mV)
- Temperature coefficient (0.1-1%/°C)
- External magnetic field interference
Practical Measurement Considerations
When measuring mixed AC+DC signals, modern clamp meters use composite sensors combining Hall-effect and current transformer technologies. The total RMS value in such cases becomes:
For high-precision DC measurements, zero-flux technology (null-balance method) is employed in laboratory-grade instruments, achieving uncertainties below 0.01%. This method uses a feedback coil to cancel the measured magnetic field, with the feedback current serving as the measurement output.
Frequency Response Characteristics
The frequency response of AC clamp meters is not flat, with typical variations shown in this response curve:
The -3dB bandwidth varies significantly between sensor types, from 1kHz for basic current transformers to 100MHz for specialized high-frequency probes. Phase accuracy becomes critical when measuring power in AC systems, with high-end instruments maintaining ±0.1° phase error up to 1kHz.
2.3 Understanding True RMS
Traditional averaging clamp meters assume a purely sinusoidal waveform and compute the root mean square (RMS) value using a simplified scaling factor of 0.707 (1/√2) applied to the peak voltage or current. However, real-world electrical systems often contain non-sinusoidal waveforms due to harmonics, switching transients, or nonlinear loads, rendering average-responding measurements inaccurate.
Mathematical Foundation of True RMS
The true RMS value of a time-varying signal x(t) is defined as the square root of the mean of the squared values over one period T:
For a discrete sampled signal with N points, this becomes:
Unlike average-responding meters, which implicitly assume x(t) = A sin(ωt), true RMS meters directly compute the integral or summation without waveform assumptions. This accounts for distortions such as:
- Harmonics (e.g., from switched-mode power supplies)
- Clipped or rectified waveforms
- Pulse-width modulated (PWM) signals
Practical Implementation in Clamp Meters
Modern true RMS clamp meters use one of two techniques:
- Thermal conversion: A heating element produces temperature proportional to the squared current, with a thermocouple measuring the resultant heat (historically used in precision instruments).
- Digital signal processing (DSP): High-speed ADCs sample the current waveform, and a microcontroller computes the RMS value using the discrete formula above (dominant in contemporary designs).
Error Sources and Bandwidth Considerations
True RMS accuracy depends on:
- Bandwidth: Must cover the highest significant harmonic (typically 1–20 kHz for power systems, up to MHz for RF applications).
- Crest factor: Defined as the peak-to-RMS ratio. High crest factors (e.g., >3:1) challenge the dynamic range of ADCs and thermal sensors.
- Sampling rate: Must satisfy the Nyquist criterion for the highest frequency component.
The measurement error ε for a sinusoidal signal with added n-th harmonic at frequency f_n can be modeled as:
where fmax is the meter's bandwidth. For example, a 5 kHz harmonic measured with a 1 kHz bandwidth meter would introduce ~12.5% error.
Applications in Power Analysis
True RMS measurements are critical for:
- Calculating real power in nonlinear loads: P = VRMS × IRMS × PF, where PF is the true power factor.
- Assessing harmonic distortion in compliance with IEEE 519-2014 standards.
- Evaluating losses in magnetic cores and conductors under nonsinusoidal excitation.

3. AC Clamp Meters
3.1 AC Clamp Meters
AC clamp meters measure alternating current (AC) non-invasively by detecting the magnetic field generated around a conductor. Unlike traditional multimeters, they do not require breaking the circuit, making them indispensable for high-current diagnostics in industrial and power distribution systems.
Operating Principle
The core mechanism relies on Faraday's Law of Induction, where a time-varying magnetic field induces a proportional voltage in a sensing coil. The clamp's ferromagnetic core concentrates the magnetic flux, enhancing sensitivity. For a sinusoidal current I(t) = Ipeak sin(ωt), the induced voltage Vind(t) is:
where N is the number of coil turns, A is the cross-sectional area of the core, and B is the magnetic flux density. For a linear magnetic material, B = μrμ0H, with H being the magnetic field strength proportional to the current.
Frequency Response and Bandwidth
AC clamp meters exhibit a frequency-dependent sensitivity due to the core's permeability μr(f) and coil impedance. The usable bandwidth typically ranges from 50/60 Hz (power-line frequencies) to 1 kHz for general-purpose models, while high-end units extend to 100 kHz for harmonic analysis. The transfer function H(f) can be modeled as:
where R and L are the coil's resistance and inductance. Core losses (hysteresis, eddy currents) dominate at higher frequencies, necessitating laminated or ferrite cores in wideband designs.
Calibration and Accuracy
Accuracy is influenced by:
- Core saturation: Nonlinearity at high currents (>1 kA) requires Hall-effect or fluxgate sensors in hybrid designs.
- Phase error: Coil reactance introduces a phase shift between I(t) and Vind(t), critical for power measurements.
- Positioning error: Off-center conductors or nearby magnetic fields distort readings by up to 3%.
Modern instruments compensate for these effects via digital signal processing (DSP), achieving ±1% basic accuracy. Traceability to national standards requires calibration with a reference shunt and current transformer.
Advanced Applications
Beyond RMS current measurement, AC clamp meters enable:
- Harmonic analysis: FFT-based decomposition of current waveforms to identify distortion (THD up to 50th harmonic).
- Inrush current capture: Peak-hold functions with sampling rates >10 kS/s to track motor startups or transformer energization.
- Phase synchronization: Dual-clamp configurations for power factor and phase-angle measurements in three-phase systems.

3.2 DC Clamp Meters
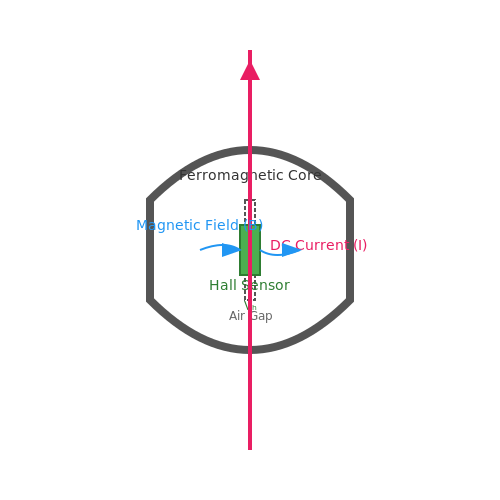
DC clamp meters measure direct current by employing the Hall effect, a phenomenon where a voltage difference (the Hall voltage) is generated across an electrical conductor transverse to an electric current and a magnetic field perpendicular to the current. Unlike AC clamp meters, which rely on electromagnetic induction, DC clamp meters require active circuitry to detect and quantify the magnetic field produced by the current-carrying conductor.
Hall Effect Principle
The Hall voltage VH is given by:
where:
- I is the current flowing through the conductor,
- B is the magnetic flux density,
- n is the charge carrier density,
- e is the electron charge,
- t is the thickness of the conductor.
In a DC clamp meter, a Hall sensor is placed in the air gap of a ferromagnetic core. When the clamp is closed around a current-carrying conductor, the magnetic field generated by the DC current is concentrated by the core, and the Hall sensor produces a voltage proportional to the field strength.
Signal Conditioning and Calibration
The raw Hall voltage is typically in the millivolt range and requires amplification and filtering. Modern DC clamp meters use instrumentation amplifiers with high common-mode rejection ratios (CMRR) to minimize noise. The amplified signal is then digitized and processed by a microcontroller, which applies calibration coefficients to account for nonlinearities and temperature drift.
Temperature compensation is critical, as the Hall coefficient and core permeability vary with temperature. Advanced models employ thermistors or digital temperature sensors to dynamically adjust the calibration.
Practical Considerations
Key sources of error in DC clamp measurements include:
- Core saturation: Excessive current can saturate the ferromagnetic core, leading to nonlinearity.
- External magnetic fields: Stray fields from nearby equipment can interfere with measurements.
- Jaw alignment: Imperfect closure of the clamp jaws introduces an air gap, reducing sensitivity.
High-end DC clamp meters mitigate these issues through:
- Zero-flux technology (null-balance method) to avoid core saturation,
- Shielded cores to reject external fields,
- Precision-machined jaws for consistent closure.
Applications
DC clamp meters are indispensable in:
- Power electronics: Measuring DC bus currents in inverters and converters,
- Battery systems: Monitoring charge/discharge currents in Li-ion or lead-acid batteries,
- Automotive: Diagnosing starter motor or alternator currents.
Hybrid Clamp Meters (AC/DC)
Hybrid clamp meters combine the principles of Hall-effect and current transformer (CT) sensing to measure both alternating current (AC) and direct current (DC) with high precision. Unlike traditional clamp meters, which rely solely on inductive coupling for AC measurements, hybrid models integrate a Hall-effect sensor to detect DC and low-frequency AC components.
Operating Principle
The core mechanism involves two distinct sensing elements:
- Current Transformer (CT): Utilizes Faraday’s law of induction to measure AC currents. The alternating magnetic field induces a proportional voltage in the secondary winding, which is then converted to a current reading.
- Hall-Effect Sensor: Detects DC and low-frequency AC by measuring the voltage generated across a semiconductor when exposed to a magnetic field (Hall voltage, \( V_H \)). The relationship is given by:
where \( I_H \) is the bias current, \( B \) is the magnetic flux density, \( n \) is the charge carrier density, \( e \) is the electron charge, and \( d \) is the thickness of the Hall element.
Mathematical Derivation of Combined Sensitivity
The total output voltage \( V_{out} \) of a hybrid clamp meter is the superposition of the CT and Hall-effect contributions. For a sinusoidal AC current \( I_{AC} = I_0 \sin(\omega t) \) and a DC current \( I_{DC} \), the combined response is:
where \( k_{CT} \) and \( k_{Hall} \) are sensitivity constants for the CT and Hall-effect sensor, respectively. Integrating the AC term yields:
This dual-mode operation allows seamless switching between AC and DC measurements without recalibration.
Practical Applications
Hybrid clamp meters are indispensable in:
- Power Electronics: Measuring ripple currents in DC-DC converters or inverter output currents with mixed AC/DC components.
- Automotive Diagnostics: Analyzing starter motor currents (high DC) or alternator outputs (AC ripple superimposed on DC).
- Renewable Energy Systems: Monitoring photovoltaic array currents (DC) and grid-tie inverter outputs (AC).
Error Sources and Compensation
Key challenges include:
- DC Offset Drift: Temperature variations affect Hall sensor bias. Modern designs use auto-zeroing circuits to mitigate this.
- Phase Shift in CT: High-frequency attenuation due to parasitic capacitance. Digital signal processing (DSP) techniques correct phase alignment.
- Cross-Talk: Magnetic interference between AC and DC paths. Shielded cores and orthogonal sensor placement minimize coupling.
Advanced Features in Modern Designs
Recent innovations include:
- True-RMS Hybrid Clamp Meters: DSP-based computation of RMS values for distorted waveforms.
- Wireless Data Logging: Bluetooth-enabled models stream real-time data to analytical software.
- High-Frequency Bandwidth: Some models extend DC-100 kHz ranges for switch-mode power supply analysis.

Specialized Clamp Meters (Leakage, Harmonic Analysis)
Leakage Current Clamp Meters
Leakage current clamp meters are designed to measure small residual currents that escape from an electrical system, typically due to insulation breakdown or capacitive coupling. These devices operate by detecting the imbalance between the phase and neutral conductors, which manifests as a ground leakage current. The measurement principle relies on the magnetic field generated by the differential current, which is resolved using a high-sensitivity Hall-effect sensor or a fluxgate transducer.
Modern leakage clamp meters can resolve currents as low as 1 mA, with bandwidths extending up to several kHz to capture transient leakage events. Applications include:
- Insulation integrity testing in industrial equipment
- Ground fault detection in medical electrical systems
- Energy efficiency audits by quantifying parasitic losses
Harmonic Analysis Clamp Meters
Harmonic analysis clamp meters incorporate Fast Fourier Transform (FFT) processing to quantify distortion in AC waveforms. These instruments measure the harmonic content up to the 50th order (typically 2.5 kHz for 50 Hz systems), with accuracy specified by IEC 61000-4-7 standards. The total harmonic distortion (THD) is computed as:
Key features include:
- Simultaneous measurement of RMS, fundamental, and harmonic components
- Phase-angle detection for harmonic source identification
- Compliance logging for IEEE 519-2014 power quality standards
Advanced Signal Processing
High-end models employ digital signal processors with 16-bit ADCs sampling at ≥100 kS/s. The anti-aliasing filters are typically 8th-order elliptic designs with cutoff frequencies set at 0.4 × Nyquist frequency. For interharmonic analysis, specialized algorithms like the IEC 61000-4-30 Class A resampling technique are implemented.
Hybrid Measurement Systems
Recent developments combine leakage and harmonic measurement capabilities with power quality analysis. These systems use time-synchronized sampling across multiple clamp channels to compute:
- Vectorial summation of leakage currents in three-phase systems
- Harmonic-powered dissipation (HPD) in non-linear loads
- Predictive failure analysis through trended harmonic signatures
Calibration of these instruments requires traceable standards with ≤0.5% basic accuracy for current and phase measurements. Field verification is typically performed using calibrated current injectors like the Fluke 5500A or similar metrology-grade sources.
4. Safety Precautions and Best Practices
4.1 Safety Precautions and Best Practices
Electrical Safety Fundamentals
Clamp meters operate in environments where high currents and voltages are present, necessitating strict adherence to electrical safety protocols. The primary hazards include:
- Arc flash risks when measuring live circuits exceeding 600V.
- Transient voltage spikes in industrial settings, which can exceed the meter’s rated category (CAT III/CAT IV).
- Magnetic field induction from high-current conductors, potentially distorting measurements.
Always verify the meter’s voltage category (e.g., CAT III 1000V) matches the measurement environment. For circuits above 50V, use insulated gloves and face shields when probing.
Meter-Specific Precautions
Modern clamp meters integrate both current and voltage measurement capabilities, requiring distinct safety checks:
- Jaw alignment: Misaligned jaws can cause air gaps, reducing measurement accuracy by up to 30% and increasing arc risk.
- Burden voltage: In current measurement mode, ensure the clamp’s internal shunt resistance doesn’t exceed $$ R_{shunt} < \frac{0.1V}{I_{max}} $$ where \( I_{max} \) is the expected current.
- Creepage distance: Inspect for carbon tracking or contamination on the PCB that could compromise isolation.
where \( R_{jaw} \) is the contact resistance (typically 0.1–0.5Ω for alloy jaws).
Measurement Best Practices
Current Clamping
For accurate AC current measurements:
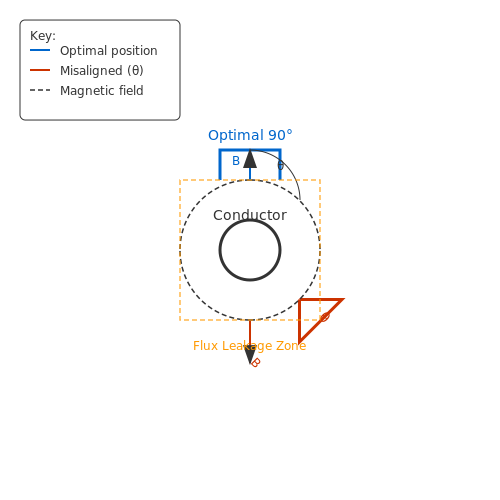
- Center the conductor in the jaw to minimize flux leakage errors (<5° angular misalignment).
- Account for DC offset in mixed AC/DC systems using True-RMS meters with bandwidth >1kHz.
- For currents below 5A, wrap the conductor multiple times (\( N \)) and divide readings by \( N \).
Voltage Measurement
When using lead-based voltage inputs:
- Employ the live-dead-live test procedure to verify meter functionality.
- For three-phase systems, measure phase-phase and phase-neutral voltages sequentially to detect imbalances.
Environmental Considerations
Clamp meter accuracy degrades under extreme conditions:
| Parameter | Safe Range | Error Contribution |
|---|---|---|
| Temperature | -10°C to 50°C | ±0.1%/°C beyond 23°C |
| Humidity | <80% RH | +0.5% @ 90% RH |
| EMI | <3V/m | ±2% @ 10V/m RF |
Calibration and Maintenance
Advanced users should:
- Perform zero-flux calibration before high-precision DC measurements using the nulling function.
- Verify frequency response by comparing 50/60Hz readings with 1kHz signals (should match within ±1%).
- Inspect Hall-effect sensors annually for Gauss range degradation using a known magnetic field source.
4.2 Measuring Current (AC/DC)
Fundamentals of Current Measurement with Clamp Meters
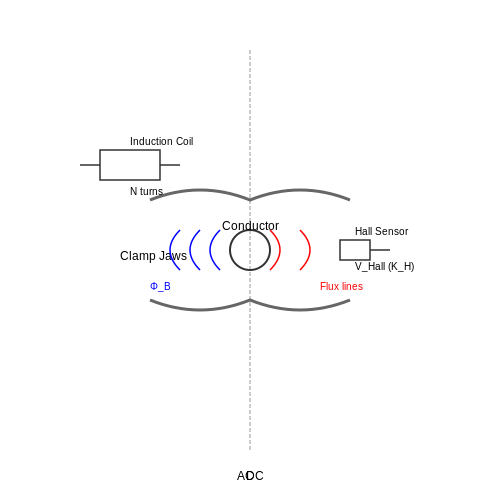
Clamp meters measure current non-invasively by detecting the magnetic field generated around a conductor. The core principle relies on Faraday's Law of Induction for AC measurements and the Hall Effect for DC measurements. For AC currents, a time-varying magnetic field induces a voltage in the clamp meter's coil, proportional to the current:
where N is the number of coil turns and ΦB is the magnetic flux. For DC currents, a Hall-effect sensor detects the static magnetic field, producing an output voltage:
where KH is the Hall coefficient, I is the sensor bias current, and B is the magnetic flux density.
AC Current Measurement
When measuring AC, the clamp meter's iron core concentrates the magnetic field, and the induced voltage is rectified and processed to display RMS current. Key considerations:
- Frequency range: Most clamp meters operate between 50Hz–1kHz, with high-precision models supporting up to 100kHz.
- Waveform distortion: Non-sinusoidal waveforms (e.g., PWM, harmonics) require True-RMS meters for accuracy.
- Phase alignment: Ensure the clamp jaws fully encircle the conductor to avoid flux leakage.
DC Current Measurement
Hall-effect-based clamp meters measure DC by detecting the Lorentz force on charge carriers. Critical factors include:
- Zero adjustment: Residual magnetism requires nulling before measurement.
- Temperature drift: Hall sensors exhibit ≈0.1%/°C sensitivity variation, necessitating thermal compensation.
- External fields: Stray magnetic fields >3mT may introduce errors; shield sensitive measurements.
Practical Measurement Techniques
For high-current (>100A) or high-frequency (>10kHz) applications:
- Use a Rogowski coil for fast transient capture (di/dt > 1kA/µs).
- Employ split-core clamps for permanent installations without conductor disconnection.
- Verify accuracy with a known current source; typical clamp meters achieve ±(1.5% + 5 digits).
Advanced Applications
Clamp meters enable:
- Power analysis: Combined with voltage measurement, compute real power P = VIcosφ.
- Harmonic analysis: Advanced models perform FFT to quantify THD up to the 50th harmonic.
- Leakage detection: Differential current measurement identifies ground faults below 1mA.
For three-phase systems, measure individual phase currents while ensuring balanced loading. Asymmetry exceeding 10% may indicate faults:
4.3 Measuring Voltage and Resistance
Voltage Measurement with Clamp Meters
Modern clamp meters integrate voltage measurement capabilities through separate test leads, despite their primary function being current measurement via induction. The voltage measurement circuit operates in parallel with the load, adhering to Kirchhoff's voltage law. For AC voltage, the meter typically employs a precision rectifier circuit followed by an RMS converter, while DC voltage measurements use a high-impedance voltage divider (input impedance >10MΩ) to minimize circuit loading.
Where Rmeter is the input impedance of the clamp meter and Rsource is the Thévenin equivalent resistance of the measured circuit. For accurate readings, ensure:
- Probe contact resistance < 1Ω (clean probes regularly)
- Voltage range selection exceeds expected values to prevent saturation
- Creepage distances maintained for high-voltage measurements (>600V)
Resistance Measurement Methodology
Resistance measurement in clamp meters utilizes a constant current source (typically 1mA or lower for high-resistance measurements) and measures the resulting voltage drop across the unknown resistor. The meter automatically calculates resistance using Ohm's law:
Key considerations include:
- Nulling probe resistance: Always subtract lead resistance (use REL/zero function)
- Circuit isolation: Ensure no parallel paths or powered circuits exist
- Four-wire Kelvin measurement: Essential for resistances below 10Ω (available in advanced models)
Practical Measurement Challenges
When measuring voltage in high-impedance circuits (>100kΩ), the meter's input impedance forms a significant voltage divider. For example, measuring a 10V signal through a 1MΩ source impedance with a 10MΩ meter yields:
For resistance measurements in noisy environments, modern clamp meters employ:
- Phase-locked detection for AC superimposed signals
- Guarded inputs to reduce leakage currents
- Auto-ranging algorithms with noise rejection
Advanced Techniques
High-end clamp meters (e.g., Fluke 376 FC) combine voltage and current measurements to compute derived parameters:
Where θ is the phase angle between voltage and current. Some models implement synchronous sampling at >5kHz to maintain phase accuracy in variable frequency systems (40-500Hz).

4.4 Using Inrush Current Functionality
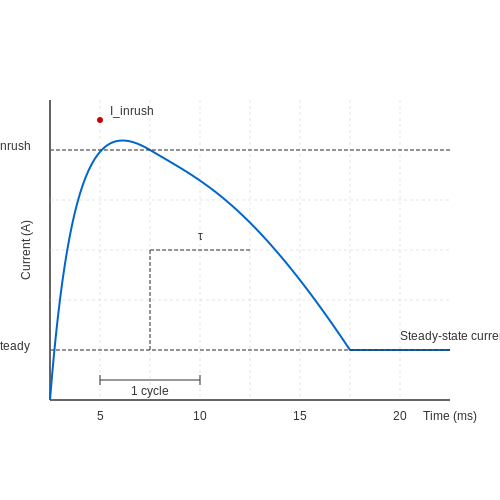
Inrush current, the transient surge occurring when an electrical device is first energized, can exceed steady-state current by an order of magnitude. Clamp meters equipped with inrush current functionality capture this phenomenon by sampling at high frequencies (typically 1–10 kHz) over a short duration (50–500 ms). The measurement principle relies on integrating the current waveform during the initial cycle:
where i(t) is the instantaneous current and T is the integration period (usually one AC cycle). Advanced models employ digital signal processing to isolate the inrush component from noise.
Measurement Methodology
To measure inrush current accurately:
- Set the clamp meter to inrush mode, which triggers sampling upon detecting a rising edge.
- Use peak-hold or min/max capture to record transient values before averaging.
- Account for inductive loads (e.g., motors, transformers) where inrush may persist for multiple cycles.
The time constant τ of the load determines the decay profile:
where L is inductance and R is resistance. For purely resistive loads, inrush current approximates a step function.
Practical Considerations
Inrush measurements are sensitive to:
- Contact bounce in mechanical switches, which introduces measurement artifacts.
- Phase angle at energization, as switching at voltage zero-crossing minimizes inrush in inductive loads.
- Temperature effects on conductor resistance, altering peak current magnitude.
For three-phase systems, clamp meters with synchronized multi-channel sampling are required to capture asymmetrical inrush across phases. The worst-case scenario occurs when one phase is energized while others remain open, leading to:
Applications
Inrush data informs:
- Circuit breaker sizing to avoid nuisance tripping.
- Soft-start circuit design for motor control.
- Transformer derating analysis to prevent magnetic saturation.
4.5 Data Logging and Connectivity Features
Modern clamp meters integrate advanced data logging capabilities, enabling long-term monitoring of electrical parameters with high temporal resolution. The sampling rate fs determines the maximum frequency component that can be accurately captured, as dictated by the Nyquist criterion:
where fmax represents the highest measurable frequency without aliasing. High-end models achieve sampling rates exceeding 10 kS/s, sufficient for capturing transient events in power quality analysis.
Memory Architecture and Storage Formats
Two primary memory architectures dominate:
- Circular buffers: Continuously overwrite oldest data when full, ideal for fault detection in intermittent events
- Linear storage: Record until memory capacity is reached, preferred for scheduled load studies
Data typically stores in CSV or binary formats, with IEEE 754 floating-point representation ensuring 32-bit precision. The memory depth M relates to sampling duration T by:
Connectivity Protocols
Standardized interfaces enable integration with supervisory control systems:
| Protocol | Bandwidth | Typical Use Case |
|---|---|---|
| Bluetooth 5.0 | 2 Mbps | Mobile technician applications |
| Wi-Fi 802.11ac | 1.3 Gbps | Industrial IoT deployments |
| USB 3.0 | 5 Gbps | High-speed laboratory acquisition |
Wireless Synchronization
Precision Time Protocol (PTP, IEEE 1588) enables μs-level synchronization across distributed measurement nodes. The synchronization error ε depends on network asymmetry Δ and clock drift δ:
Industrial Communication Standards
Modbus TCP and PROFINET implementations allow direct PLC integration. The register mapping follows IEEE 754 conventions for analog values, with discrete states encoded in bitmasked words. Typical response times range from 10-100 ms depending on network topology.
For power quality monitoring, IEC 61850-9-2 sampled value streams provide real-time voltage/current phasors with 1 μs timestamp resolution, enabling synchrophasor applications in smart grid deployments.
5. Electrical Maintenance and Troubleshooting
5.1 Electrical Maintenance and Troubleshooting
Principles of Current Measurement in Maintenance
Clamp meters operate based on the principle of magnetic induction, where a current-carrying conductor generates a proportional magnetic field. The Hall-effect sensor or current transformer within the clamp detects this field and converts it into a measurable voltage. For AC systems, the relationship between the magnetic field B and current I is given by:
where μ0 is the permeability of free space and r is the radial distance from the conductor. In DC measurements, Hall-effect sensors rely on the Lorentz force acting on charge carriers:
where VH is the Hall voltage, n is charge carrier density, e is electron charge, and t is sensor thickness.
Advanced Diagnostic Techniques
Clamp meters enable non-intrusive diagnosis of:
- Harmonic distortion: By measuring true RMS current, clamp meters identify harmonic content exceeding IEEE 519-2022 limits.
- Phase imbalance: Simultaneous measurement of currents in three-phase systems reveals imbalances >5% that indicate motor winding faults.
- Inrush currents: High-speed sampling (>1 kHz) captures startup currents up to 10× rated values in motors and transformers.
Practical Case Study: Motor Circuit Analysis
Consider a 3-phase induction motor drawing unbalanced currents:
where Iavg = (Ia + Ib + Ic)/3. A reading >5% suggests either:
- Voltage imbalance (measure line-to-line voltages)
- Winding insulation breakdown (perform megger test)
- Rotor bar defects (analyze current signature with FFT)
Measurement Best Practices
For accurate readings:
- Position the clamp perpendicular to the conductor axis to minimize flux leakage
- Use jaw guards when measuring >600V systems
- Account for DC offset in VFD-driven motors by enabling AC+DC measurement mode
- Verify meter bandwidth covers the highest harmonic of interest (typically 40th harmonic for power quality)
Safety Considerations
When troubleshooting live circuits:
- Maintain minimum approach distances per NFPA 70E
- Use CAT III 1000V/CAT IV 600V rated meters for panel work
- Verify meter fuses are properly rated for the circuit protection
- Employ wireless clamp meters for measurements in hazardous locations
5.2 HVAC System Diagnostics
Current Measurement in HVAC Systems
Clamp meters are indispensable for diagnosing HVAC systems due to their non-invasive current measurement capability. In HVAC applications, the primary parameters of interest are line current, inrush current, and compressor motor current. The relationship between current and system performance is governed by:
where I is the current, P is the real power, V is the RMS voltage, and cos(φ) is the power factor. Deviations from rated current values indicate potential issues such as refrigerant leaks, compressor wear, or electrical faults.
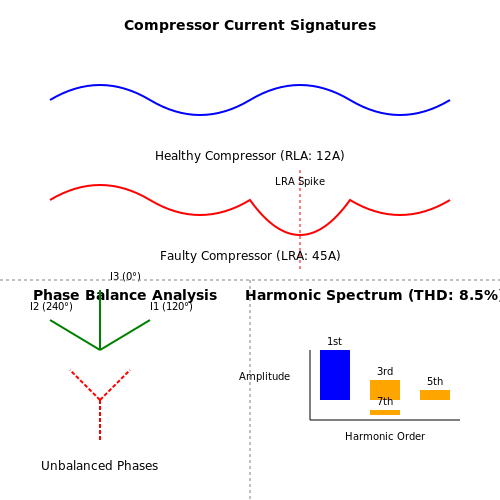
Diagnosing Compressor Issues
Compressor motors typically exhibit specific current signatures when failing:
- High current with low cooling output suggests refrigerant overcharge or condenser blockage
- Low current with high vibration indicates mechanical wear in bearings
- Erratic current fluctuations point toward electrical winding faults
The compressor's locked rotor current (LRA) and run-load current (RLA) should be measured during startup and steady-state operation respectively. A properly functioning compressor will show:
Three-Phase System Analysis
For commercial HVAC systems with three-phase power, clamp meters enable phase imbalance detection. The acceptable imbalance threshold is:
Exceeding this threshold causes excessive heating in windings and reduces motor lifespan. Simultaneous measurement of all three phases using multiple clamp meters (or a three-phase clamp meter) provides the most accurate diagnostic data.
Harmonic Analysis in Variable Frequency Drives
Modern HVAC systems with VFDs require true-RMS clamp meters capable of harmonic analysis. The total harmonic distortion (THD) in current should satisfy:
High THD causes overheating in motors and transformers, while specific harmonic patterns can identify rectifier or IGBT faults in VFDs. Advanced clamp meters with harmonic analysis capabilities can detect these issues before catastrophic failure occurs.
Practical Measurement Techniques
For accurate HVAC diagnostics:
- Measure current at both the contactor and compressor terminals
- Compare measurements against manufacturer's specifications
- Record trends over time to identify gradual degradation
- Use temperature measurements in conjunction with current readings
5.3 Industrial Motor Current Analysis
Fundamentals of Motor Current Measurement
Three-phase induction motors dominate industrial applications, and their current signatures provide critical diagnostic insights. A clamp meter measures the RMS current in each phase, enabling analysis of imbalances, harmonics, and efficiency losses. The line current IL relates to motor power P and power factor cos(θ) as:
where VL is the line voltage and η is the motor efficiency. Current imbalances exceeding 5% between phases indicate winding faults, voltage asymmetry, or mechanical loading issues.
Harmonic Distortion Analysis
Modern clamp meters with True-RMS capability and harmonic analysis (up to 50th order) reveal non-sinusoidal distortions caused by variable frequency drives (VFDs). Total Harmonic Distortion (THD) is quantified as:
where Ih is the RMS current at harmonic order h. THD values above 10% necessitate filtering to prevent overheating and torque pulsations.
Inrush Current Characterization
During startup, induction motors draw inrush currents 5–8 times the rated current. A clamp meter with min/max recording captures this transient, which typically decays within 0.1–2 seconds. The inrush profile helps assess:
- Rotor bar integrity: Asymmetrical decay suggests broken bars.
- Starter performance: Soft-starters reduce inrush to 2–4× rated current.
- Supply capacity: Prolonged inrush may trip overcurrent protection.
Case Study: Detecting Bearing Wear
A 15 kW motor exhibited a 12% current imbalance and elevated 2× line frequency harmonics. Clamp meter data revealed:
- Phase currents: 28.4 A, 31.7 A, 26.8 A (5.6% imbalance)
- THDI = 8.3%, dominated by 2nd (4.2%) and 5th (3.1%) harmonics
Spectrogram analysis identified sideband frequencies at fs ± fbearing, confirming outer race bearing wear. Replacement restored current balance to 2.1% and reduced THD to 3.8%.
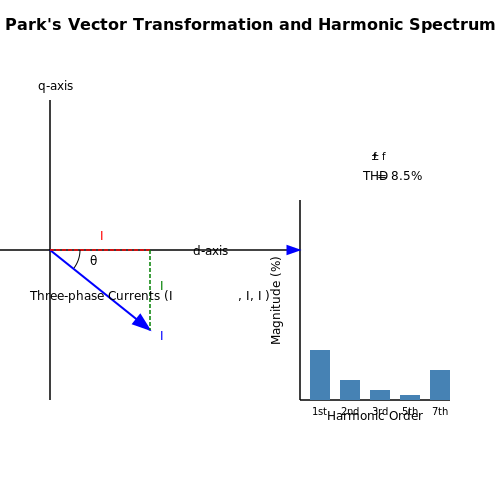
Advanced Techniques: Park's Vector Analysis
For deeper fault detection, transform three-phase currents into direct-quadrature (DQ) components:
Healthy motors produce a circular Park's vector plot. Eccentricity or winding faults distort this into elliptical or cloverleaf patterns, detectable with high-resolution clamp meters and oscilloscope integration.
5.4 Renewable Energy System Monitoring
Current and Power Measurement in Renewable Systems
Clamp meters are indispensable for monitoring current and power in renewable energy systems, where fluctuating loads and variable generation conditions necessitate precise measurements. In photovoltaic (PV) arrays, wind turbines, and battery storage systems, clamp meters enable non-invasive current measurement without disrupting the circuit. The power output of a PV system, for instance, is derived from:
where V is the voltage, I is the current measured by the clamp meter, and θ is the phase angle between voltage and current. For DC systems (e.g., solar panels), cos(θ) = 1, simplifying the calculation to P = VI.
Harmonic Distortion Analysis
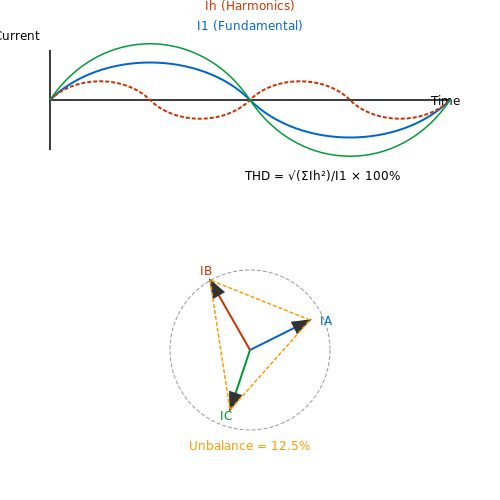
Inverter-based renewable systems introduce harmonic distortions due to switching frequencies. Advanced clamp meters with True RMS capabilities and harmonic analysis functions quantify total harmonic distortion (THD) using:
where Ih is the harmonic current component and I1 is the fundamental frequency current. High THD (>5%) can indicate inverter malfunctions or grid compatibility issues.
Battery Storage System Monitoring
Clamp meters measure charge/discharge currents in battery banks to assess state of charge (SOC) and system efficiency. For lithium-ion batteries, the current integral over time yields SOC:
where SOC0 is the initial state, Cn is the nominal capacity, and I(τ) is the time-varying current measured by the clamp meter.
Grid-Tied System Compliance
Grid-tied renewable systems must adhere to IEEE 1547 and IEC 61727 standards. Clamp meters verify compliance by measuring:
- Leakage currents (fault detection),
- Unbalance (difference between phase currents),
- Peak inrush currents during inverter startup.
For example, grid codes often limit current unbalance to <5%. A clamp meter measures phase currents IA, IB, and IC, with unbalance calculated as:
Case Study: Wind Turbine Generator Monitoring
A 2 MW doubly-fed induction generator (DFIG) was monitored using a high-accuracy clamp meter (0.5% ±5 A). The meter captured rotor currents under varying wind speeds, revealing a 12% THD during low-wind conditions due to PWM switching artifacts. Corrective filtering reduced THD to 3%, improving grid synchronization.
6. Recommended Books and Manuals
6.1 Recommended Books and Manuals
- PDF User Manual ENGLISH Power Clamp-On Meter Model 606 - AEMC — 8 Clamp-On Meter Model 606 - User Manual 1.3 PRECAUTIONS FOR USE This device complies with safety standards IEC/EN 61010-1 or BS EN 61010-1 and IEC/EN 61010-2-032 or BS EN 61010-2-032 for voltages of 1000 V in CAT IV and 1500 V in CAT III. These safety instructions are intended to ensure the safety of persons and proper operation of the device.
- PDF Clamp-on Meter 601 - Aemc — CLAMP-ON METER ENGLISH User Manual . 2 . CONTENTS. ... For best results from your instrument and for your safety, read the enclosed operating instructions carefully and comply with the precautions for use. These ... Clamp-on Meter Model 601..... Cat. #2139.30 Includes set of 2 color-coded silicone insulated test leads, test probes and alligator ...
- AEMC INSTRUMENTS 606 USER MANUAL Pdf Download | ManualsLib — Clamp-On Meter Model 606 - User Manual... Page 28: Diode Test 3. Connect the test probes or the alligator clips to the circuit or component to be tested. The measured value is displayed on the screen. 4. Reverse the leads on the diode and repeat the test. The measured value is displayed on the screen Clamp-On Meter Model 606 - User Manual...
- PDF USER MANUAL FLIR MODEL CM85 A TRUE RMS POWER CLAMP METER - Instrumart — 6.2.1 Disposal of Electronic Waste 26 7. ... computer language in any form or by any means, electronic, magnetic, optical, manual or ... Thank you for selecting the FLIR CM85 1000A Power Clamp Meter. This device is shipped fully tested and calibrated and, with proper use, will provide years of reliable service. ...
- PDF Model KM 2006 - Kusam Electrical — 6-1 ACA Measurement : With the clamp disconnected from any conductor, switch the function selector to A~ range. Open the clamp by pressing the jaw-opening handle and insert the Cable to be measured into the jaw. Close the clamp and get the reading from the LCD panel. Note : Before this measurement, disconnect any test lead with the meter for ...
- PDF DIGITAL CLAMP METER OPERATOR'S INSTRUCTION MANUAL - Mastech Türkiye — DIGITAL CLAMP METER DIGITAL CLAMP METER • If the casing is not covered properly, screws are not tightened, do not put it to use. • When it is not in use for a long time, please remove the battery and avoid storing it in the place with high temperature and humidity. 3. Each component name description 3.1 Meter panel V 20 A 600 V 600 2 A 200 ...
- user manual clamp meter PCE-MCM 10 — Note: After restarting the meter, automatic power off is reactivated. 6 Making a measurement To make a measurement, remove the measuring clamp from the meter and unwind the cable completely. Clamp the current clamp around the cable to be measured. Pay attention to the direction of current flow. This is marked on the current clamp.
- PDFM 6.1 Portable Doppler Flow Meter | Pulsar Measurement — The extruded aluminum enclosure with protective covers guard the PDFM 6.1 against damage from falls or impacts that can occur when using the meter in real-world applications. The meter is ready for use outside thanks to IP67-rated connectors and a bright LCD display which makes seeing the screen easy even in the brightest environments.
- PDF ENGLISH User Manual - AEMC — 6 Clamp-on Meter Model 403 1. INTRODUCTION Thank you for purchasing an AEMC® Instruments Model 403 Clamp-on Meter. For best results from your instrument and for your safety, read the enclosed operating instructions carefully and comply with the precautions for use. These products must only be used by qualified and trained users.
- PDF USER MANUAL True RMS 600A Solar Clamp Meter with METERLiNK — Remove test leads from the meter before taking clamp measurements. CAUTION The maximum current rating for the supplied MC4 test leads is 10 A at 140℉ (60℃) maximum. CAUTION Disconnect the test leads from the test points before changing meter functions. CAUTION Do not use the device for a procedure that it is not intended for. This can cause ...
6.2 Online Resources and Tutorials
- KAIWEETS KC602 - True-Rms Smart Clamp Meter Manual — Kaiweets KC602 User Manual View and Read online. AC/DC current measurement. Est. reading time 11 minutes. KC602 Circuit Tester manuals and instructions online. Download Kaiweets KC602 PDF manual.
- PDF DIGITAL CLAMP METER - Mastech Türkiye — 1. General instructions This digital clamp meter has been designed according to International Electro Safety Standard IEC-61010 concerning safety requirements for electronic measuring instruments and hand-held current clamps; meeting the requirements for 600CAT.II of IEC-61010 and grade 2 for pollution.
- Clamp Meter - Mastering The Art of Measurement - EN.B.r00 — The document provides instructions on how to use a clamp meter to measure various electrical parameters. It describes the parts of the clamp meter, functions of buttons and switches. It also explains concepts like Ohm's law, Kirchhoff's laws and provides examples of how to measure voltage, current, resistance, capacitance, frequency and more using the clamp meter.
- Fluke 302+, 303, 305 - Clamp Meter Manual | ManualsLib — Fluke 302+ User Manual View and Read online. Est. reading time 9 minutes. 302+ Measuring Instruments manuals and instructions online. Download Fluke 302+ PDF manual.
- user manual clamp meter PCE-MCM 10 — 6 Making a measurement To make a measurement, remove the measuring clamp from the meter and unwind the cable completely. Clamp the current clamp around the cable to be measured. Pay attention to the direction of current flow. This is marked on the current clamp. Only one cable must be in the current clamp at a time.
- PDF User Manual IGM Clamp Meter with METERLiNK — Thank you for selecting the FLIR CM276 Imaging Clamp meter, this instru-ment combines clamp meter and multimeter functionality with cutting edge thermal imaging capabilities.
- PDF New Model Clamp meter-Mastering The Art of Measurement_EN — 1.1 Versions of the clamp meter There are two versions of this clamp meter which are CL101B and CL101C. The main difference between them is that the current clamp in version CL101C can measure DC-AC current, but the current clamp in version CL101B can measure only AC current.
- PDF Mastering The Art of Measurement (Clamp Meter) - Plusivo — Introduction erature and continuity test using clamp meter. We are going to study some bas c concepts like Ohm' L w and Ki Let's get started!
- PDF OPERATING INSTRUCTIONS - Sperry Instruments — A continually cycling tone will be emitted and the clamp light will flash when the meter senses AC voltage greater than ~50V electrostatic fields. Occasionally a static charge may interfere with the meter detection and the meter may om
- PDF ENGLISH User Manual - AEMC — NOTE (2): Use of the thermal time constant (0.7min/°C): If there is a sudden variation of the temperature of the clamp, by 10°C for example, the clamp will be at 99% (cnst = 5) of the final temperature after 0.7min/°Cx10°Cx5 = 35 min (the time constant of the external sensor must be added to this value).
6.3 Industry Standards and Safety Guidelines
- IEC 61010-2-033:2023 - Safety requirements for ... - iTeh Standards — IEC 61010-2-033:2023 specifies safety requirements for hand-held multimeters and other meters for domestic and professional use, capable of measuring mains. Hand-held multimeters are multi-range multifunction measuring instruments intended to measure voltage and other electrical quantities such as resistance or current.
- PDF Measuring and Testing Safely Guide - staubli.com — Introduction Concerns about safety issues and usability of test accessories in compliance with applica-ble standards are brought up time and again. Therefore, there is a need for this matter to be explained, as it can be a bit dificult to under-stand. This brochure "Measuring and Testing Safely" gives you some useful information to make it easier for you to select and use the right test ...
- PDF Sscman91-710v3 - Af — This volume establishes the system safety program requirements, minimum design, test, inspection, hazard analyses, and data requirements for hazardous and safety critical launch vehicles, payloads, and ground support equipment, systems, and materials for Space Systems Command (SSC) ranges, including the Eastern Range (ER) and Western Range (WR).
- PDF Rail Transit Track Inspection and Maintenance — Specific types of track design and track construction are described in Sections 12 through 14. APTA rail transit safety standards represent an industry consensus on safety practices for rail transit systems (RTS) to help achieve a high level of safety for passengers, employees and the general public.
- What Are ASME's Inspection Standards for Clamps Used in Overhead Lifts? — What are the inspection standards for clamp lifting devices? The American Society of Mechanical Engineers (ASME) sets the standard for all inspections, including types and frequencies.
- PDF Efficient Electrical Systems Design Handbook - dl.icdst.org — IEEE Recommended Practice For Electric Power Distribution For Industrial Plants, Chapter 7, (IEEE Red Book), ANSI/IEEE Std. 141-1986. Guidelines On Electrical Power For ADP Installations, Chapter 3, Federal Information Processing Standards Publication, (PIPS PUB 94), U.S. Department of Commerce, National Bureau of Standards.
- PDF Specific Guidance for Calibration Laboratories in Electro -Technical — List of equipment/ process for which accreditation shall not be granted, is as per the ENAO decision based on the requirements of their industries/organizations. The following suggestions may be followed: Reference Multimeters having < 5 1⁄2 Digit Display. Clamp on meters/ Clamp Meter with DMM as Standard for measuring capability of high current.
- PDF NAVSEA STANDARD ITEM DATE: 18 NOV 2016 2. REFERENCES: 2.1 Standard ... — 4.6.2 Connector Fabrication Supervisor Qualification requirement: Successful completion of the classroom training required in 4.5.5 plus be the incumbent of a supervisory electrical or electronic mechanic position.
- PDF A Guide to United States Electrical and Electronic Equipment ... - NIST — With respect to electrical and electronic products, the Act prescribes test procedures to measure energy efficiency, energy use, water use, or estimated annual operating cost of a covered product during a representative annual use cycle or period of use as well as charging the Federal Trade Commission with the responsibility of establishing ...


