Plasma Displays and Their Operation
1. Basic Principles of Plasma Technology
Basic Principles of Plasma Technology
Plasma as the Fourth State of Matter
Plasma, often referred to as the fourth state of matter, is an ionized gas consisting of free electrons, ions, and neutral atoms or molecules. Unlike solids, liquids, or gases, plasma exhibits collective behavior due to long-range electromagnetic interactions between charged particles. The ionization process occurs when sufficient energy is applied to a gas, stripping electrons from atoms and creating a quasi-neutral mixture of charged and neutral particles. This state is governed by the plasma frequency and Debye length, which define its characteristic spatial and temporal scales.
Here, ωp is the plasma frequency, λD is the Debye length, ne is the electron density, e is the electron charge, ϵ0 is the permittivity of free space, me is the electron mass, kB is the Boltzmann constant, and Te is the electron temperature.
Gas Discharge and Ionization Mechanisms
Plasma generation in displays relies on gas discharge phenomena, where an electric field accelerates free electrons, causing collisions that ionize neutral gas atoms. Two primary ionization mechanisms dominate:
- Electron-impact ionization: An electron with sufficient kinetic energy collides with a neutral atom, ejecting another electron and forming a positive ion.
- Penning ionization: A metastable excited state of one gas species ionizes another gas species through energy transfer, prevalent in gas mixtures like neon-xenon.
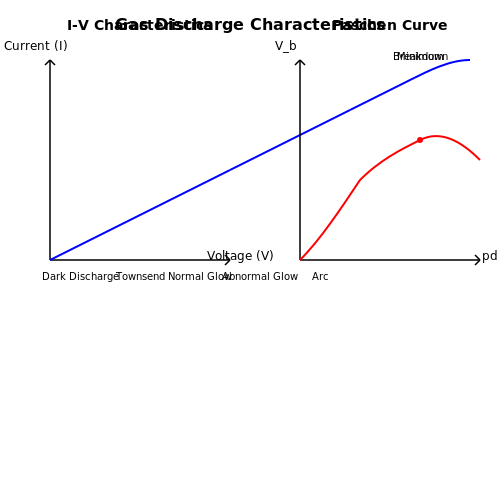
The Townsend discharge model describes the exponential growth of electron avalanches under an applied electric field E, characterized by the Townsend coefficient α:
Here, A and B are gas-dependent constants, and p is the gas pressure. When the product αd (where d is the electrode gap) exceeds a threshold, breakdown occurs, sustaining plasma.
Photon Emission and Color Generation
Plasma displays exploit vacuum ultraviolet (VUV) emission from excited xenon atoms (Xe*) or molecules (Xe2*), which peak at 147 nm and 173 nm, respectively. These VUV photons strike phosphor coatings, inducing visible light via photoluminescence. The dominant reactions are:
where M is a third-body stabilizer (typically neon). RGB color fidelity is achieved by tuning phosphor compositions, such as:
- Red: (Y,Gd)BO3:Eu3+
- Green: Zn2SiO4:Mn2+
- Blue: BaMgAl10O17:Eu2+
Microdischarge Dynamics in Plasma Panels
Each pixel in a plasma display panel (PDP) comprises a microscopic discharge cell filled with a neon-xenon mixture (~300–500 Torr). Addressing is achieved via matrix-driven electrodes:
- Sustain electrodes: Parallel conductive strips on front and rear glass substrates, separated by a dielectric layer and MgO protective coating.
- Address electrodes: Orthogonal to sustain electrodes, triggering specific cells via voltage pulses.
The memory effect enables bistable operation, where wall charges accumulated during discharge alter the local field, reducing the firing voltage for subsequent pulses. This allows subfield modulation for grayscale control via pulse-number modulation.
Energy Efficiency Considerations
PDP efficiency η is limited by VUV generation (~15% of input power) and phosphor conversion (~20%). The total luminous efficacy is approximated by:
Modern designs optimize efficiency using rib structures to confine plasma, high-Xe-content gas (10–20%) for increased VUV yield, and reflective phosphor layouts to maximize light extraction.
Structure and Components of a Plasma Display
Basic Architecture
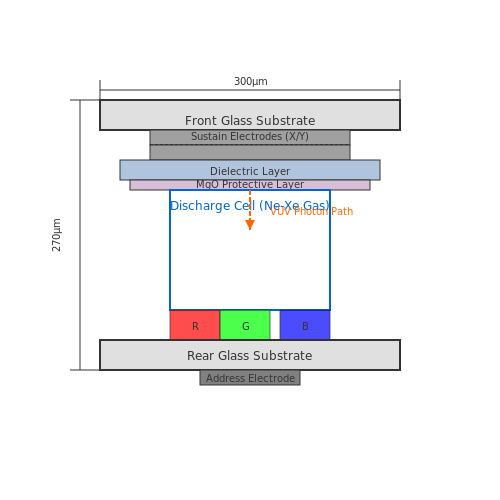
A plasma display panel (PDP) consists of multiple layers arranged between two glass substrates. The front substrate contains transparent electrodes, while the rear substrate houses address electrodes and phosphor layers. Sandwiched between these substrates is a narrow gap filled with a mixture of noble gases (neon, xenon) at low pressure. When voltage is applied, the gas ionizes into plasma, emitting ultraviolet (UV) light that excites phosphors to produce visible light.
Electrode Configuration
The display employs three types of electrodes:
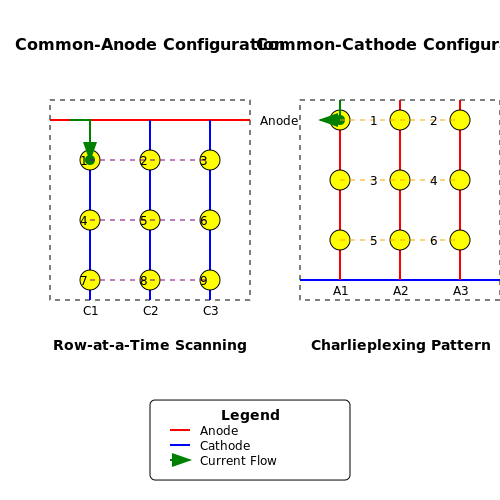
- Scan electrodes (parallel to rows)
- Sustain electrodes (parallel to scan electrodes)
- Address electrodes (perpendicular to scan/sustain electrodes)
These form a grid where each intersection defines a subpixel cell. The sustain electrodes maintain plasma discharge, while address electrodes initiate the discharge.
Cell Structure and Gas Composition
Each subpixel contains:
- A microcavity filled with gas (typically 90% neon, 10% xenon)
- Phosphor coatings (red, green, or blue)
- Dielectric and MgO protective layers
The xenon concentration affects UV emission efficiency, governed by:
where α is a proportionality constant, ne is electron density, nXe is xenon density, and ⟨σv⟩ is the reaction cross-section.
Driving Circuitry
The PDP requires specialized drivers:
- High-voltage sustain drivers (150-200V)
- Address drivers (60-80V)
- Control ICs for pulse-width modulation
Energy recovery circuits minimize power consumption by recycling charge during sustain pulses. The power per pulse is:
where Cp is panel capacitance and Vs is sustain voltage.
Phosphor Materials
Common phosphors include:
- Red: (Y,Gd)BO3:Eu3+
- Green: Zn2SiO4:Mn2+
- Blue: BaMgAl10O17:Eu2+
Phosphor degradation mechanisms include:
- UV-induced aging
- Ion bombardment
- Thermal quenching
1.3 Gas Mixtures and Their Role in Plasma Displays
Composition and Ionization Characteristics
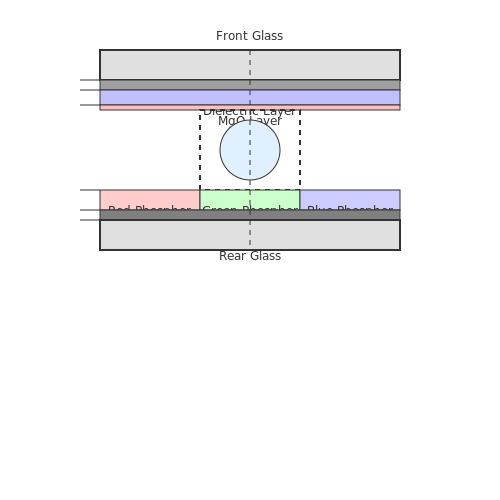
The gas mixture in a plasma display panel (PDP) primarily consists of noble gases—typically neon (Ne) and xenon (Xe)—due to their favorable ionization properties. The Penning effect, where metastable states of one gas species ionize another, enhances discharge efficiency. A common mixture is 95–99% Ne with 1–5% Xe, though argon (Ar) or helium (He) may be added to modify discharge characteristics. The ionization energy of Xe (12.13 eV) is lower than that of Ne (21.56 eV), making it the primary UV photon emitter upon recombination.
where \( h \) is Planck’s constant, \( c \) is the speed of light, and \( E_{Xe} \) is the energy gap between excited and ground states in xenon.
Pressure and Discharge Dynamics
Gas pressure typically ranges between 400–600 Torr, balancing luminance and voltage requirements. Higher pressures increase UV emission but demand higher sustain voltages, governed by Paschen’s law:
where \( V_s \) is the breakdown voltage, \( p \) is pressure, \( d \) is electrode gap, \( A \) and \( B \) are gas-dependent constants, and \( \gamma \) is the secondary electron emission coefficient.
Role of Xenon in UV Emission
Xe* (excited xenon) emits VUV photons at 147 nm and 173 nm when returning to the ground state. These photons excite phosphors (e.g., red: Y2O3:Eu3+, green: Zn2SiO4:Mn2+, blue: BaMgAl10O17:Eu2+). The Xe concentration directly impacts luminous efficacy, with empirical studies showing a near-linear relationship up to 10% Xe:
Additives and Their Effects
Small amounts of helium (He) reduce firing voltage due to its lower ionization energy (24.59 eV for He vs. 21.56 eV for Ne). Argon (Ar) is occasionally added to stabilize discharge, but its higher sputtering yield can degrade electrode lifetime. Trace hydrogen (H2) may be introduced to scavenge impurities, though excessive H2 quenches UV emission.
Practical Trade-offs in Mixture Design
- Luminance vs. Efficiency: Higher Xe concentrations increase UV output but require higher sustain voltages, reducing power efficiency.
- Color Saturation: Optimal Xe levels balance blue phosphor excitation (147 nm) and red/green response (173 nm).
- Lifetime: Gas purity must exceed 99.999% to prevent discharge poisoning by contaminants like O2 or H2O.
Advanced Mixtures for High-Speed Addressing
High-speed addressing (e.g., for 600 Hz subfield drives) benefits from ternary mixtures like Ne-Xe-He (97:2:1), where He’s lower mass reduces ion mobility, enabling faster discharge extinctions. The reduced ion transit time \( \tau \) is approximated by:
where \( \mu \) is ion mobility and \( E \) is the electric field.
2. Electrical Excitation and Plasma Formation
2.1 Electrical Excitation and Plasma Formation
Fundamentals of Plasma Discharge
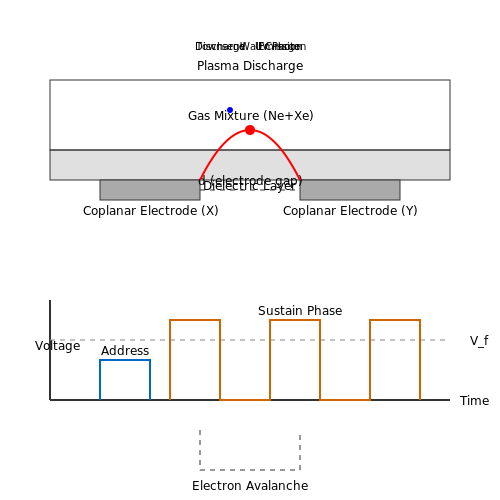
Plasma formation in display panels relies on electrical breakdown of a gas mixture (typically neon-xenon) under an applied electric field. When the electric field exceeds the breakdown threshold, free electrons gain sufficient energy to ionize gas atoms through collisions, creating an ionized plasma state. The process follows the Townsend discharge mechanism, where electron multiplication occurs via avalanche ionization.
Here, α is the Townsend ionization coefficient, E is the electric field, p is gas pressure, and A, B are gas-dependent constants.
Electrode Configuration and Voltage Requirements
Plasma displays use coplanar sustain electrodes separated by a dielectric layer. A firing voltage (Vf) of 150–300 V is applied between electrodes, creating a localized discharge. The voltage must satisfy the Paschen curve for the gas mixture:
where d is the electrode gap, and γ is the secondary electron emission coefficient.
Microdischarge Dynamics
Each discharge cell operates as a microscopic capacitive plasma reactor. The current-voltage characteristics follow:
where C is the cell capacitance, ne is electron density, A is electrode area, and vd is electron drift velocity. The discharge pulse duration is typically 1–10 µs with current densities of 0.1–1 A/cm².
Gas Mixture Optimization
Neon-xenon mixtures (1–10% Xe) are preferred due to:
- High UV photon yield (147 nm from Xe*2 excimers)
- Low operating voltage compared to pure noble gases
- Minimized electrode sputtering
The Penning effect between Ne and Xe further reduces the breakdown voltage by 15–20%.
Addressing and Sustain Phase
Modern plasma displays use address-display separation (ADS) driving:
- Address phase: A weak discharge primes selected cells (50–100 V)
- Sustain phase: Alternating pulses (150–200 kHz) maintain plasma in active cells
The wall charge accumulation on dielectrics enables memory effect, critical for grayscale control.
Pixel Addressing and Color Generation
Subpixel Structure and Addressing
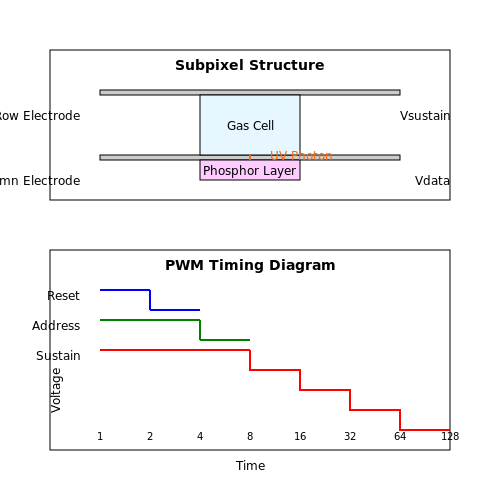
Plasma display panels (PDPs) employ a matrix-addressed subpixel structure, where each pixel comprises three subpixels—red, green, and blue (RGB)—each containing a sealed gas-filled cell. Addressing is achieved through a grid of row (scan) electrodes and column (data) electrodes. The intersection of these electrodes defines the subpixel location. To activate a subpixel, a sustain voltage pulse (typically 150–200 V) is applied across its row and column electrodes, ionizing the gas (typically neon-xenon) and generating ultraviolet (UV) photons.
Here, \( V_{\text{sustain}} \) is the baseline AC sustain voltage, while \( V_{\text{data}} \) is the addressing pulse amplitude. The total voltage must exceed the gas breakdown threshold, governed by Paschen's law:
where \( p \) is gas pressure, \( d \) is electrode gap, and \( A \), \( B \), \( \gamma \) are gas-dependent constants.
Pulse-Width Modulation for Grayscale
Grayscale is achieved through pulse-width modulation (PWM) of the sustain pulses. A frame is divided into multiple weighted subfields (e.g., 8 subfields for 256 grayscale levels), each with a duration proportional to a binary power (1, 2, 4, ..., 128). The human eye integrates these pulses, perceiving intermediate brightness. The luminance \( L \) of a subpixel is:
where \( k \) is a phosphor efficiency constant, \( n_i \) is the pulse count in subfield \( i \), and \( \tau_i \) is the subfield duration.
Color Generation Mechanism
UV photons (147 nm wavelength) excite RGB phosphors coated on the cell walls. The phosphors’ quantum efficiency \( \eta \) and chromaticity coordinates determine the displayed color. The dominant wavelength \( \lambda_d \) of each subpixel is given by:
where \( E_g \) is the bandgap energy of the phosphor material, and \( \Delta E \) accounts for Stokes shift losses. Color balance is calibrated by adjusting the PWM weight ratios of the RGB subfields.
Addressing Techniques
Modern PDPs use Address Display Period Separation (ADS) to separate addressing and sustain phases, minimizing crosstalk. In ADS:
- Reset Phase: A ramp voltage initializes all cells to a uniform charge state.
- Address Phase: Data pulses selectively ignite target subpixels.
- Sustain Phase: AC pulses maintain illumination in addressed cells.
The addressing time per row \( t_{\text{addr}} \) must satisfy:
where \( T_{\text{frame}} \) is the frame duration (e.g., 16.7 ms for 60 Hz), \( N_{\text{sf}} \) is the number of subfields, and \( T_{\text{sustain}} \) is the sustain period per subfield.
Real-World Optimization
High-end PDPs employ dynamic false contour reduction (DFCR) algorithms to mitigate artifacts caused by rapid grayscale transitions. This involves redistributing subfield weights temporally and spatially, leveraging human visual system latency. Advanced drivers also implement adaptive power control, scaling sustain pulse frequency with APL (Average Picture Level) to maintain consistent power draw.
2.3 Refresh Rates and Image Stability
Fundamentals of Refresh Rate in Plasma Displays
The refresh rate in plasma displays is governed by the periodic excitation of phosphor cells via microsecond-scale electrical pulses. Unlike liquid crystal displays (LCDs), plasma panels do not suffer from pixel persistence issues due to their self-emissive nature. However, refresh rate still critically impacts:
- Flicker perception: Sub-60 Hz refresh rates induce visible flicker due to phosphor decay characteristics.
- Motion resolution: Higher refresh rates (≥600 Hz subfield driving) reduce dynamic false contour artifacts.
- Power consumption: Each refresh cycle requires gas ionization energy (~300–400V pulses).
Mathematical Model of Flicker Threshold
The critical flicker frequency (CFF) for plasma displays follows Ferry-Porter’s law, modified for phosphor decay time constants:
Where: I = luminance (cd/m²), a ≈ 12.5 (empirical constant for xenon plasma), b ≈ 0.3 (phosphor-dependent coefficient), τp = phosphor persistence time (typically 1–5 ms for RGB phosphors).
Subfield Driving Technique
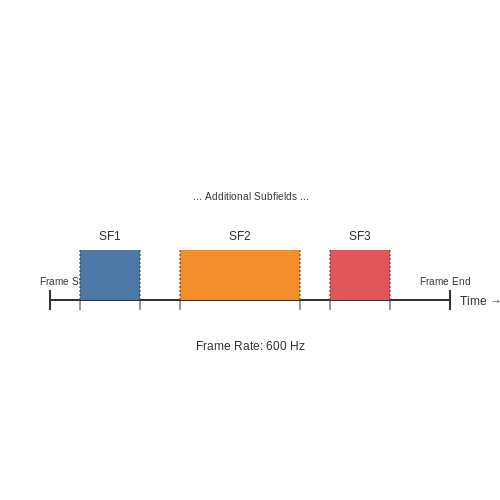
Plasma displays achieve effective refresh rates exceeding 600 Hz through time-division grayscale. Each frame is divided into 8–12 weighted subfields with pulse-width modulated sustain periods:
The shortest subfield (SF1) determines the system’s minimum addressable time quantum, typically 1.67 μs for 600 Hz operation.
Image Stability Challenges
Two key instability mechanisms occur in plasma refresh cycles:
- Dynamic false contours: Caused by temporal dithering artifacts when displaying moving images with subfield weighting. Mitigated through error diffusion algorithms and non-binary subfield distributions.
- Phosphor lag: Differential decay rates of red (Zn2SiO4:Mn), green (BaAl12O19:Mn), and blue (MgAl11O19:Eu) phosphors cause color-specific afterimages.
Quantifying Motion Blur
The modulation transfer function (MTF) for moving images incorporates refresh parameters:
Where Thold is the effective pixel illumination time (≈80% of subfield duration) and σsub quantifies subfield timing jitter (typically <0.1 μs in modern panels).
3. Image Quality and Viewing Angles
3.1 Image Quality and Viewing Angles
The image quality of a plasma display is governed by several factors, including luminance uniformity, color gamut, contrast ratio, and viewing angle performance. Unlike LCDs, which rely on backlight modulation, plasma displays generate light directly through gas discharge, resulting in distinct advantages and trade-offs in image fidelity.
Luminance and Color Gamut
Plasma displays achieve high luminance (typically 300–1000 cd/m²) due to the intense UV emission from ionized xenon gas, which excites phosphors. The color gamut is determined by the phosphor composition, with modern displays covering 80–90% of the NTSC standard. The spectral emission of each subpixel (red, green, blue) follows:
where Iλ is the spectral intensity, ϵ(λ) is the phosphor efficiency, ΦUV is the UV photon flux, and ηph is the quantum yield of the phosphor.
Contrast Ratio
Plasma displays exhibit superior native contrast ratios (10,000:1 to 1,000,000:1) because each pixel can be fully extinguished (true black). The contrast is derived from the ratio of peak luminance to the off-state luminance:
where Lmax and Lmin are the display's maximum and minimum luminance, Lambient is ambient light, and Rreflectance is the screen reflectivity.
Viewing Angle Performance
Plasma displays inherently offer wide viewing angles (≥160° horizontal/vertical) due to the Lambertian emission profile of phosphors. The angular luminance drop follows a cosine law:
where L0 is the on-axis luminance, θ is the viewing angle, and n is a fitting parameter (typically 1.2–1.5 for plasma). This minimizes color shift compared to LCDs, where liquid crystal alignment causes polarization-dependent losses.
Pixel Crosstalk and Dynamic False Contour
At extreme angles, pixel crosstalk can arise from UV scattering in the gas mixture, reducing color purity. Additionally, dynamic false contours—artifacts caused by temporal dithering in grayscale reproduction—become visible during rapid motion. These are mitigated via subfield modulation techniques and improved cell barriers.
Practical Implications
In broadcast studios and home theaters, plasma's wide viewing angles ensure consistent image quality for off-axis viewers. However, ambient light reduces perceived contrast due to the glossy front glass. Anti-reflective coatings and neutral density filters are often applied to mitigate this.
For HDR applications, plasma's per-pixel light control rivals OLED, but the lower peak luminance (vs. LED-LCD) limits its suitability for ultra-bright environments.
3.2 Energy Consumption and Heat Dissipation
Plasma displays exhibit unique energy consumption characteristics due to their reliance on gas discharge phenomena. The power dissipation in a plasma display panel (PDP) is primarily governed by the ionization of inert gases (typically a mixture of neon and xenon) and the subsequent UV photon emission that excites phosphors. The total power Ptotal can be decomposed into three main components:
Here, Pion represents the power consumed during gas ionization, Puv accounts for UV photon generation, and Pelec includes losses in the driving circuitry. The ionization power is dominant and scales with the sustain voltage Vs and current Is:
where fs is the sustain frequency and Cp is the panel capacitance per pixel. The sustain frequency typically ranges between 50 kHz and 200 kHz, depending on the display resolution and refresh rate.
Thermal Management in Plasma Displays
Heat dissipation in PDPs arises from two primary sources: resistive losses in the electrodes and the inefficiency of UV photon generation (only ~15% of input power converts to visible light). The thermal load per unit area Q'' can be approximated by:
where ηth is the thermal loss fraction (~0.85 for typical PDPs) and A is the active display area. For a 50-inch 1080p plasma display operating at 300 W, this results in a heat flux of approximately 0.5 W/cm², necessitating active cooling measures.
Cooling System Design Considerations
Effective thermal management in plasma displays employs:
- Heat spreaders: Thin graphite or aluminum layers distribute heat laterally from hot spots
- Forced convection: Strategically placed fans maintain air flow rates of 1-2 m/s across the rear panel
- Phase-change materials: Some high-end designs incorporate paraffin-based PCMs with melting points near 45°C
The thermal resistance network for a typical PDP cooling solution can be modeled as:
where values typically range from 0.5 to 2.0 K/W for commercial displays. Maintaining junction temperatures below 85°C is critical for preventing phosphor degradation and gas mixture breakdown.
Energy Efficiency Improvements
Modern PDP designs implement several techniques to reduce power consumption:
- Address Display Period Separation (ADS): Separates addressing and sustain periods to minimize reactive power
- High-Xe gas mixtures: Increasing xenon content from 5% to 15% improves UV conversion efficiency by ~40%
- Variable sustain frequency: Dynamically adjusts fs based on image content luminance requirements
The efficacy improvement Δη from High-Xe mixtures follows:
where σ represents the excitation cross-section and n the gas density. Practical implementations achieve 2.5-3.0 lm/W efficacy, compared to 1.8 lm/W for standard mixtures.
This section provides a rigorous technical examination of plasma display energy consumption mechanisms and thermal management strategies, suitable for advanced readers. The content flows from fundamental power dissipation principles to specific engineering solutions, with mathematical derivations where appropriate. All HTML tags are properly closed and formatted according to the specifications.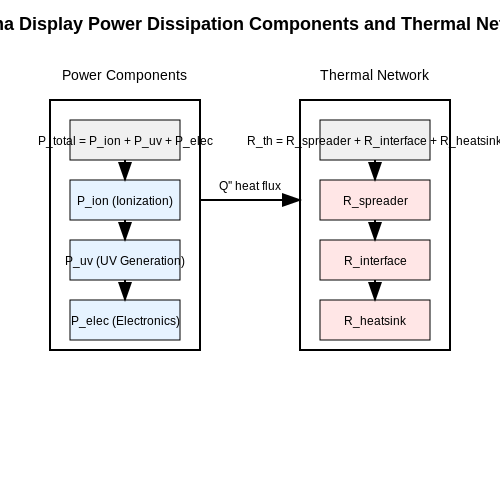
3.3 Lifespan and Burn-in Issues
Lifespan of Plasma Displays
The operational lifespan of a plasma display panel (PDP) is primarily determined by the degradation of its phosphor materials and the gradual loss of emissive efficiency in its gas discharge cells. A typical PDP has a half-life of approximately 60,000 to 100,000 hours, defined as the time taken for the display's luminance to degrade to 50% of its initial value. The primary mechanisms contributing to this degradation include:
- Phosphor aging due to prolonged exposure to ultraviolet (UV) radiation from plasma discharge.
- Gas depletion, where the neon-xenon mixture loses efficacy over time.
- Electrode erosion caused by ion bombardment during discharge cycles.
The luminance decay follows an exponential relationship:
where L(t) is the luminance at time t, L0 is the initial luminance, and λ is the decay constant, dependent on the phosphor composition and discharge intensity.
Burn-in Phenomenon
Burn-in occurs when static images displayed for extended periods cause uneven phosphor wear, leading to permanent ghost images. This is particularly problematic in applications like digital signage or control panels where static elements (e.g., logos, menus) are common. The burn-in mechanism involves:
- Differential phosphor degradation: Areas displaying bright static content degrade faster than others.
- Charge accumulation in the dielectric layers, altering discharge characteristics locally.
The severity of burn-in can be modeled by the following empirical relation:
where ΔL is the luminance differential, I(x,y,t) is the pixel intensity at position (x,y) and time t, γ is a material-dependent exponent (typically 1.5–2.5 for PDP phosphors), and k is a proportionality constant.
Mitigation Techniques
Modern plasma displays employ several strategies to combat burn-in and extend lifespan:
- Pixel orbiting: Periodic shifting of the image by a few pixels to distribute wear.
- Dynamic voltage scaling: Adjusting drive voltages based on image content to reduce stress on high-intensity regions.
- White flashing: Brief full-screen white pulses to discharge accumulated ions uniformly.
Advanced PDPs incorporate real-time luminance compensation algorithms that adjust pixel drive signals based on accumulated usage history, effectively implementing:
where Vadj is the adjusted pixel voltage, V0 is the nominal voltage, and α is a calibration constant.
Accelerated Aging Tests
Manufacturers use accelerated aging protocols to predict display lifespan, typically involving:
- Continuous operation at elevated temperatures (70–90°C) to accelerate chemical degradation.
- High-contrast static pattern display to induce accelerated burn-in.
- Periodic measurements of color coordinates (CIE xy) and luminance uniformity.
The Arrhenius equation governs temperature-dependent aging:
where tlife is the predicted lifespan, A is a pre-exponential factor, Ea is the activation energy for the dominant degradation process, k is Boltzmann's constant, and T is the absolute temperature.
4. Consumer Electronics and Large-Screen Displays
4.1 Consumer Electronics and Large-Screen Displays
Plasma display panels (PDPs) were once a dominant technology in large-screen televisions and commercial displays due to their superior contrast ratios, wide viewing angles, and fast response times compared to early-generation LCDs. The underlying principle relies on gas discharge physics, where ionized noble gases (typically a mixture of neon and xenon) emit ultraviolet (UV) light upon electrical excitation, which then stimulates phosphors to produce visible light.
Structure and Operation of Plasma Displays
A plasma display consists of millions of tiny cells sandwiched between two glass plates. Each cell contains a gas mixture and is coated with red, green, or blue phosphors. Electrodes arranged in a grid pattern apply alternating high-voltage pulses, ionizing the gas and generating a plasma discharge. The resulting UV photons excite the phosphors, producing visible light.
The discharge process can be modeled using the Townsend avalanche mechanism, where free electrons gain sufficient energy in an electric field to ionize gas molecules, creating an electron-ion cascade. The sustaining voltage Vs required to maintain the discharge is given by:
where E is the electric field strength, d is the gap between electrodes, and γ is the secondary electron emission coefficient.
Addressing and Grayscale Control
Plasma displays use a combination of sustain pulses and address pulses to control brightness. Grayscale is achieved through subfield driving, where each frame is divided into multiple weighted subfields with varying pulse durations. The luminance L of a pixel is proportional to the sum of the sustain pulses:
where k is a constant, wi is the weight of the i-th subfield, and ni is the number of sustain pulses in that subfield.
Advantages and Limitations in Consumer Applications
Plasma displays offered several advantages over competing technologies:
- Superior motion handling due to microsecond-level response times, eliminating motion blur.
- Deep blacks and high contrast (up to 5,000,000:1 in later models) because each pixel emits its own light and can be completely turned off.
- Wide viewing angles (nearly 180°), making them ideal for large-screen home theaters.
However, challenges such as high power consumption, screen burn-in, and manufacturing costs led to their decline in favor of OLED and advanced LCD technologies. Additionally, the minimum pixel size was constrained by discharge physics, limiting resolution improvements compared to LCDs.
Modern Applications and Legacy
While largely phased out in consumer markets, plasma technology remains relevant in niche applications such as:
- High-altitude and military displays, where performance under extreme temperatures is critical.
- Legacy large-format signage, where longevity and brightness uniformity are prioritized.
Recent research explores hybrid approaches, such as combining plasma excitation with quantum dots, to improve efficiency and color gamut while retaining the benefits of self-emissive displays.
--- This section provides a rigorous technical breakdown of plasma display operation, addressing both theoretical and practical aspects while maintaining a structured flow for advanced readers. or additional details.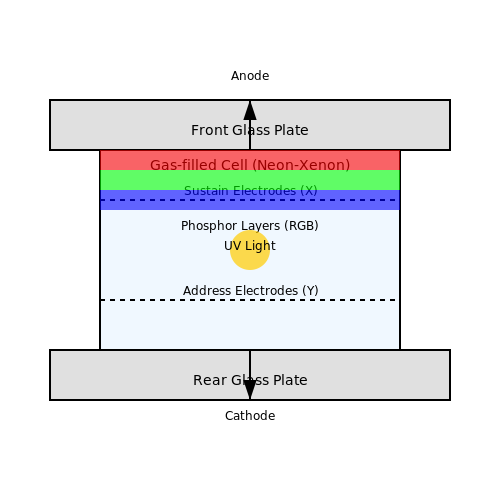
4.2 Industrial and Professional Uses
High-Brightness Applications
Plasma displays excel in environments requiring high luminance and wide viewing angles, such as control rooms, medical imaging, and aerospace instrumentation. Their self-emissive nature eliminates backlight bleed, critical for precision monitoring. The luminance L of a plasma pixel is governed by:
where η is the luminous efficacy (typically 2-4 lm/W for xenon-based discharges), P is discharge power, and t is sustain pulse duration. Industrial variants achieve 1000-1500 cd/m², outperforming LCDs in sunlight-readable applications.
Avionics and Military Systems
Certified plasma panels meet DO-160G and MIL-STD-810H standards for vibration, temperature (-40°C to +70°C), and electromagnetic interference. Key advantages include:
- Microsecond response times for synthetic vision systems
- No image retention during prolonged static displays (unlike OLED)
- Gas mixture tuning for specific spectral outputs (e.g., 587 nm for compatibility with night vision goggles)
Medical Imaging Displays
DICOM-compliant plasma monitors provide:
- 12-bit grayscale resolution through pulse-width modulation of sustain cycles
- 0.1% temporal luminance variation for flicker-free operation
- Wider color gamut than CRT for digital pathology (covering 97% of Adobe RGB)
The modulation transfer function (MTF) for a plasma pixel array is given by:
where f is spatial frequency, p is pixel pitch, and σ accounts for discharge spread (typically 0.2-0.3 pixel widths).
Broadcast Master Control
Studio-grade plasma monitors feature:
- 10Gbps SDI interfaces with <1 μs latency
- 3D lookup tables for ITU-R BT.2020 color space
- Built-in waveform monitors using in-panel photodiodes
The color volume V_c of a plasma display exceeds LCD by 40-60% due to simultaneous high luminance and saturation:
Industrial HMI Applications
Ruggedized plasma touchscreens withstand:
- IP65-rated front panels with 10H hardness coatings
- 1M+ actuations for membrane switch integration
- Parallel redundancy drivers for fail-safe operation
Current industrial models achieve 100,000-hour lifespans through:
- Phosphor composition optimization (e.g., (Y,Gd)BO₃:Eu³⁺ for red)
- Dynamic power management of address electrodes
- Gas pressure stabilization (450-550 Torr) across temperature ranges
4.3 Decline and Legacy in the Display Market
Plasma display panels (PDPs) once dominated the high-end television market due to their superior contrast ratios, wide viewing angles, and fast response times compared to early liquid crystal displays (LCDs). However, by the mid-2010s, plasma technology had largely disappeared from consumer markets. The decline was driven by several key factors, including advancements in LCD and organic light-emitting diode (OLED) technologies, manufacturing cost inefficiencies, and shifting consumer preferences.
Technological Limitations and Market Pressures
Despite their advantages, PDPs suffered from inherent limitations that became increasingly problematic as competing technologies evolved. The high power consumption of plasma displays—due to the need for sustained gas ionization—made them less attractive in an energy-conscious market. Additionally, plasma screens were heavier, thicker, and more prone to screen burn-in compared to LCDs and OLEDs. The following equation illustrates the power dissipation in a plasma cell:
where Ip is the panel current, Vs is the sustain voltage, Is is the scan current, and Vp is the panel voltage. This inefficiency became a critical drawback as LCD backlighting and OLED emissive technologies improved.
Competition from LCD and OLED Technologies
The rapid advancement of LCD technology, particularly the introduction of LED backlighting and local dimming, closed the gap in contrast performance while offering lower power consumption and thinner form factors. OLED displays, with their perfect blacks, faster pixel response, and flexibility, further marginalized plasma’s market position. By 2014, major manufacturers such as Panasonic, Samsung, and LG had ceased plasma production entirely.
Legacy and Niche Applications
Though obsolete in consumer markets, plasma technology retains niche applications where its unique properties are advantageous. Large-format commercial displays, medical imaging systems, and specialized military applications still utilize PDPs for their robustness and consistent performance under extreme conditions. The legacy of plasma research also contributed to advancements in gas discharge physics, influencing modern microplasma and flat-panel lighting technologies.
Economic and Manufacturing Challenges
The decline of plasma was accelerated by economies of scale favoring LCD production. Plasma manufacturing required specialized facilities with high upfront costs, while LCD fabs benefited from broader semiconductor industry infrastructure. The following cost-per-unit comparison highlights this disparity:
where A is panel area, P is power consumption, B is backlight cost, and k1–4 are manufacturing constants. The nonlinear scaling of plasma costs made large-screen production economically unviable as LCD yields improved.
5. Key Research Papers and Technical Manuals
5.1 Key Research Papers and Technical Manuals
- PDF E-Paper Displays — 1.5 Translating Print-on-Paper into Electronic Paper 5 1.5.1 Brightness 5 1.5.2 Grayscale - Analog vs. Digital 6 1.5.3 An Overview of Approaches to Color Electronic Paper 6 1.6 The Allure of Electronic Paper vs. the Practicality of LCDs 10 1.7 The Evolution of Electrophoretic Display-Based Electronic Paper 11 1.7.1 Early History 11
- Foundations of plasma photonics: lamps, lasers, and electromagnetic ... — We also note that there are several other research topics related to plasma metamaterials, including plasma absorbers, plasma cloaks , and plasma antennas . Such plasma devices for manipulation of EM waves are understandable by handling of Maxwell's equations and typical examples shown in the following, and their feasibility is not limited ...
- SID Symposium Digest of Technical Papers: Vol 53, No 1 — SID Symposium Digest of Technical Papers is an information display journal publishing short papers and poster session content from SID's annual symposium, Display Week. ... 5-1: Student Paper: Implementation of Full-Panel Circuit Models for Interference Estimation Between Touch and Display Operation in On-Cell Touch AMOLED. Seung-Hun Choi ...
- PDF FUNDAMENTALS OF PLASMA PHYSICS - Cambridge University Press & Assessment — Fundamentals of Plasma Physics is a rigorous explanation of plasmas relevant to controlled fusion, astrophysical plasmas, solar physics, and magnetospheric plasmas, plasma thrusters, and many other plasma applications. More thorough than previous texts, it exploits new, powerful mathematical techniques to develop deeper insights into plasma ...
- (PDF) Electronic complex: displays and nanotechnology. - ResearchGate — Displays, also called electronic information displays, stand out as one of the best-known electronic components. In recent years, they have undergone a profound technological transformation, which ...
- Electronic Displays - Springer — Electronic Displays Electronic display is one of the most conspicuous electronic devices, and plays a significant role in visualizing multimedia information. The displays are used in a wide variety of consumer applications such as television, computer, calculators, scientific and military applications. Depending on the
- Field emission displays: a critical review - ScienceDirect — Other types of FPDs are also increasingly finding their way to the consumer showrooms. These include both plasma and projection displays, aimed at the high-end, large area (>40 in. diagonal) home entertainment and commercial display systems, as well as organic light emitting displays, with high-volume mass market applications in cell phones and ...
- PDF Display Technology Overview - vsb.cz — Diodes, Digital Light Processing Technology, Plasma Displays, Field Emission Displays, and Electronic Paper. For each topic the theory of operation, the structure, the advantages, and disadvantages are discussed. A table is included in order to compare the characteristics of the different display technologies.
- Plasma display panels: Physics, recent developments and key issues — In this paper, we describe the principles of operation of a plasma display panel (PDP) and the physical mechanisms controlling the performances of a PDP in terms of light emission efficiency ...
- Field emission displays: A critical review - ResearchGate — This paper discusses the unique system developed to focus the electrons across the 1.25 mm anode/cathode gap required for high voltage operation. View Show abstract
5.2 Recommended Books on Display Technologies
- PDF Introduction to Flat Panel Displays - Numilog.com — 1.3.6 Flexible displays 6 1.4 Applications of flat panel displays 6 1.4.1 Liquid crystal displays 7 1.4.2 Light-emitting diodes 7 1.4.3 Plasma display panels 8 1.4.4 Organic light-emitting devices 8 1.4.5 Field emission displays 9 References 9 2 Color science and engineering 11 2.1 Introduction 11 2.2 The eye 12 2.3 Colorimetry 15 2.3.1 ...
- Display Interfaces - Wiley Online Library — 4.5 The "Flat Panel" Display Technologies 61 4.6 Liquid-Crystal Displays 64 4.7 Plasma Displays 69 4.8 Electroluminescent (EL) Displays 71 4.9 Organic Light-Emitting Devices (OLEDs) 72 4.10 Field-Emission Displays (FEDs) 73 ... By their nature, display interfaces and the standards that govern their use are ephemeral.
- Electronic Image Display: Equipment Selection and Operation — The display chain is defined and briefly reviewed. A road map for readers with differing needs is provided. Chapter 2 introduces light and color measures and measurement. Chapter 3 provides a brief overview of electronic display operation. Both CRT and flat-panel display technologies are covered, although the emphasis is on CRT technology.
- Displays and light-emission devices - Book chapter - IOPscience — From operational viewpoint, there are two common types of plasma displays, viz DC and AC displays. The present display is designed for AC mode operation (Kim et al 2010). Besides its structural simplicity, the AC plasma display provides higher luminance with higher efficiency.
- Active-Matrix Liquid Crystal Displays - Operation, Electronics and ... — Displays engineers searched for many years in order to find the suitable flat panel display technologies that could replace CRT displays. The first successfully established flat panel technology was the plasma displays, which demonstrated to be of larger size and higher image quality compared to the CRT technology.
- PDF Display Technology Overview - vsb.cz — Diodes, Digital Light Processing Technology, Plasma Displays, Field Emission Displays, and Electronic Paper. For each topic the theory of operation, the structure, the advantages, and disadvantages are discussed. A table is included in order to compare the characteristics of the different display technologies.
- PDF E-Paper Displays — 1.5.3 An Overview of Approaches to Color Electronic Paper 6 1.6 The Allure of Electronic Paper vs. the Practicality of LCDs 10 1.7 The Evolution of Electrophoretic Display-Based Electronic Paper 11 1.7.1 Early History 11 1.8 Initial Wave of Electrophoretic Display Development 12 1.8.1 The Electrophoretic Fluid, Thresholds, and Memory 12
- Active Matrix Flat Panel Displays - SpringerLink — Other display effects, which are now appearing in commercial products, are electrophoretic displays, EPDs, in e-readers, and organic light emitting diodes, OLEDs, in some small diagonal, portable displays. The operation of all three types of display are described, although prominence is given to discussion of the operating principles of AMLCDs.
- Liquid Crystal Displays: Addressing Schemes and Electro-Optical Effects ... — LIQUID CRYSTAL DISPLAYS THE NEW EDITION OF THE GOLD-STANDARD IN TEACHING AND REFERENCING THE FUNDAMENTALS OF LCD TECHNOLOGIES This book presents an up-to-date view of modern LCD technology. Offering balanced coverage of all major aspects of the field, this comprehensive volume provides the theoretical and practical information required for the development and manufacture of high-performance ...
- Plasma display panels: Physics, recent developments and key issues — A plasma display consists of two glass plates separated by a gas gap of about 100 µ m filled with a rare gas mixture (generally Xe-Ne or Xe-Ne-He) capable of emitting UV
5.3 Online Resources and Tutorials
- 5.11 Electronic displays | PPT - SlideShare — 5.11 Electronic displays - Download as a PDF or view online for free ... Flip-flops like R-S, D, and J-K which are used for temporary data storage, counting, and other operations. Their functions and truth tables are described. ... and plasma display panels (PDPs). Emerging technologies like field emission displays (FEDs) aim to improve on LCD ...
- PDF Introduction to Flat Panel Displays - Numilog.com — 1.3.6 Flexible displays 6 1.4 Applications of flat panel displays 6 1.4.1 Liquid crystal displays 7 1.4.2 Light-emitting diodes 7 1.4.3 Plasma display panels 8 1.4.4 Organic light-emitting devices 8 1.4.5 Field emission displays 9 References 9 2 Color science and engineering 11 2.1 Introduction 11 2.2 The eye 12 2.3 Colorimetry 15 2.3.1 ...
- PDF Plasma Module Application Library Manual - COMSOL Multiphysics — Plasma Module Application Library Manual ... trademarks are the property of their respective owners, and COMSOL AB and its subsidiaries and products are not affiliated with, endorsed by, sponsored by, or supp orted by those trademark owners. ... 2 e+Ar=>e+Ars Excitation 11.5 3 e+Ars=>e+Ar Superelastic -11.5 4 e+Ar=>2e+Ar+ Ionization 15.8
- PDF Active-Matrix Liquid Crystal Displays - Operation, Electronics and ... — Flat Panel Displays seem to be the most attractive solution to this problem. Displays engineers searched for many years in order to find the suitable flat panel display technologies that could replace CRT displays. The first successfully established flat panel technology was the plasma displays, which demonstrated to be of larger size and higher
- PDF Introduction to Plasma Theory - HHU — Plasma displays are used for flat panel televisions and of course there are naturally occurring terrestrial plasmas such as lightning. The term plasma is not limited to the most common electron-ion case. One talks about electron-positron plasmas, quark-gluon plasmas. Semiconductors contain plasma consisting of electrons and holes.
- Plasma Display Panel - an overview | ScienceDirect Topics — 5.4 Plasma display panel (PDP). A plasma display panel is a type of display which consists of millions of tiny cells, which hold a mixture of noble gases(He, Xe) and a minuscule amount of mercury in between two panels of glass. When the mercury is vaporized and voltage is applied across the cell, the gases in the cells is electrically turned into a plasma which emits ultraviolet light and ...
- PDF Plasma Science and Technology - EOLSS — 3. Plasma electronics, which includes applications in which the unique properties of plasmas are used directly in devices, such as arc melters, microwave sources, switchgear, plasma displays, welders, analytical instrumentation, arc lamps, or laser tubes. There are four common fundamental requirements needed for progress in applications of plasmas.
- PDF Display Technology Overview - vsb.cz — Diodes, Digital Light Processing Technology, Plasma Displays, Field Emission Displays, and Electronic Paper. For each topic the theory of operation, the structure, the advantages, and disadvantages are discussed. A table is included in order to compare the characteristics of the different display technologies.
- PDF E-Paper Displays — 1.5.3 An Overview of Approaches to Color Electronic Paper 6 1.6 The Allure of Electronic Paper vs. the Practicality of LCDs 10 1.7 The Evolution of Electrophoretic Display-Based Electronic Paper 11 1.7.1 Early History 11 1.8 Initial Wave of Electrophoretic Display Development 12 1.8.1 The Electrophoretic Fluid, Thresholds, and Memory 12
- PDF USER GUIDE - Pervasive Displays — There is on board 40 pins FPC connector connects to Pervasive Displays Inc. (PDI)'s E Ink based EPD panels. The driving circuit supports driving PDI's 1.44 inch, 1.9 inch, 2 inch , 2.6 inch and 2.7 inch EPD panels via SPI interface. The sample Atmel Studio ASF project provides open