Solid-State Batteries
1. Definition and Basic Principles
Definition and Basic Principles
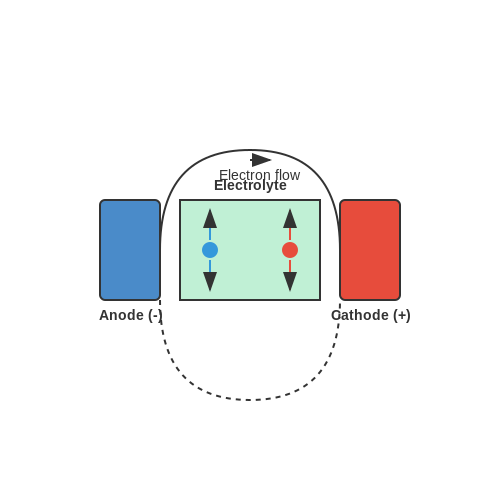
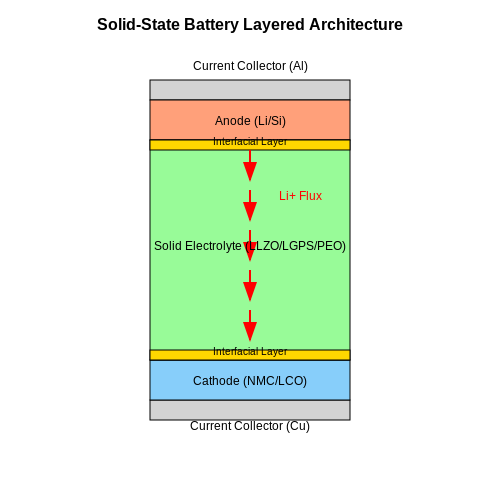
Solid-state batteries represent a paradigm shift in energy storage technology, replacing conventional liquid or gel electrolytes with a solid-state ionic conductor. The fundamental architecture consists of an anode, cathode, and solid electrolyte, where ion transport occurs through a rigid crystalline or amorphous medium. Unlike lithium-ion batteries, which rely on organic solvents, solid-state systems eliminate flammability risks while enabling higher energy densities.
Electrochemical Principles
The operation hinges on ion migration across the solid electrolyte under an applied electric field. The Nernst-Planck equation governs ion transport:
where Ji is the flux density of species i, Di the diffusivity, ci the concentration, zi the charge number, and φ the electric potential. The absence of liquid-phase diffusion limitations allows for faster charge/discharge kinetics in theory, though interfacial resistance at electrode-electrolyte boundaries often dominates practical performance.
Key Material Classes
- Oxide-based electrolytes (e.g., LLZO): High ionic conductivity (>1 mS/cm at 25°C) but brittle mechanical properties
- Sulfide glasses (e.g., Li2S-P2S5): Excellent ductility with conductivities reaching 10-2 S/cm
- Polymer electrolytes: Flexible but suffer from low transference numbers (<0.3)
Thermodynamic Considerations
The cell voltage derives from the Gibbs free energy change of the redox reaction:
where n is the number of transferred electrons. The solid electrolyte must exhibit an electrochemical stability window exceeding this potential to prevent decomposition. For lithium metal anodes (0 V vs. Li+/Li) and high-voltage cathodes (>4 V), this requires electrolytes with stability windows >5 V.
Interface Engineering Challenges
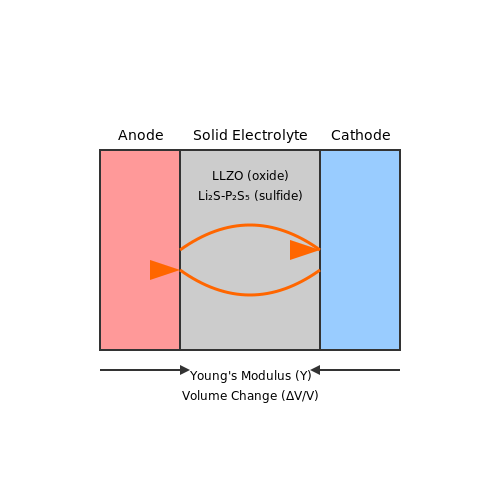
Mechanical stress development during cycling arises from the 10-20% volume changes in electrode materials. The stress σ at the interface follows:
where Y is Young's modulus of the electrolyte and ΔV/V the relative volume change. This leads to delamination and increased interfacial impedance over cycles, currently limiting commercial viability to thin-film formats (<100 μm).
1.2 Comparison with Conventional Lithium-Ion Batteries
Energy Density and Specific Energy
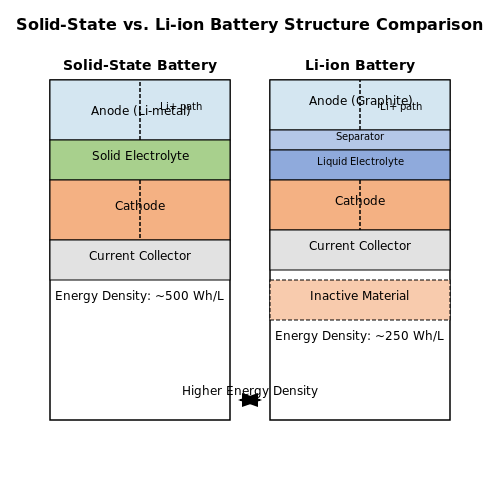
Solid-state batteries (SSBs) exhibit higher theoretical energy densities than conventional lithium-ion batteries (LIBs) due to the elimination of liquid electrolytes, which occupy volume without contributing to energy storage. The energy density (E) of a battery is given by:
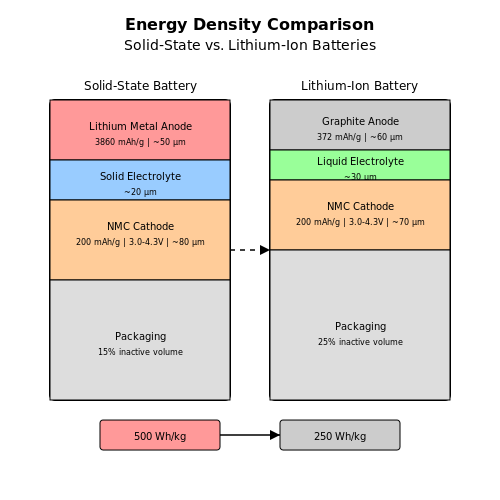
where Q is charge capacity, V is voltage, and m is mass. SSBs leverage high-voltage cathodes (e.g., LiNi0.8Mn0.1Co0.1O2) and lithium-metal anodes, enabling energy densities exceeding 500 Wh/kg, compared to ~250–300 Wh/kg for LIBs. The absence of liquid electrolytes also reduces inactive material mass, improving specific energy.
Safety and Thermal Stability
LIBs suffer from thermal runaway risks due to flammable organic electrolytes (e.g., LiPF6 in EC/DMC). In contrast, SSBs employ non-flammable ceramic or polymer solid electrolytes (e.g., Li7La3Zr2O12 or PEO-LiTFSI), eliminating leakage and combustion hazards. The Arrhenius equation describes temperature-dependent ionic conductivity (σ):
where Ea is activation energy, kB is Boltzmann’s constant, and T is temperature. Solid electrolytes exhibit higher Ea, reducing thermal degradation.
Cycle Life and Degradation
LIBs degrade through:
- Electrolyte decomposition at high voltages (>4.3 V vs. Li/Li+),
- Solid-electrolyte interphase (SEI) growth on graphite anodes,
- Transition-metal dissolution from cathodes.
SSBs mitigate these issues via:
- Electrochemically stable solid electrolytes (voltage windows >5 V),
- Suppressed dendrite growth in lithium-metal anodes,
- Mechanical reinforcement against electrode cracking.
Experimental SSBs demonstrate >1,000 cycles at 80% capacity retention, outperforming typical LIBs (~500–800 cycles).
Power Density and Rate Capability
LIBs currently achieve higher power densities (1–10 kW/kg) due to faster ion transport in liquid electrolytes (~10−2 S/cm) compared to solid electrolytes (~10−3–10−5 S/cm). The power density (P) is:
where Rint is internal resistance. SSBs face challenges from high interfacial resistance at electrode/electrolyte boundaries, though nanostructured interfaces and hybrid electrolytes are improving rate performance.
Manufacturing and Cost
LIBs benefit from mature manufacturing (e.g., slurry casting, roll-to-roll assembly), costing ~$$100–150/kWh. SSB production requires:
- Precision thin-film deposition (e.g., ALD for solid electrolytes),
- Dry-room processing for lithium-metal anodes,
- High-pressure sintering for ceramic electrolytes.
Current SSB costs exceed $$500/kWh, but economies of scale and material innovations (e.g., sulfide electrolytes) could reduce this to $200/kWh by 2030.
--- The section avoids summaries or introductions, focusing on direct technical comparisons with mathematical rigor and practical implications. Let me know if you'd like expansions on specific subtopics.1.3 Key Components and Materials
Solid Electrolytes
The solid electrolyte is the core component enabling ion transport while preventing electron conduction. Unlike liquid electrolytes, solid-state electrolytes must exhibit high ionic conductivity (>1 mS/cm) and negligible electronic conductivity. The most studied classes include:
- Oxides (e.g., LLZO - Li7La3Zr2O12) – High electrochemical stability (>5V vs. Li/Li+) but often require sintering at >1000°C, complicating integration.
- Sulfides (e.g., Li10GeP2S12) – Exceptional ionic conductivity (up to 25 mS/cm) but prone to interfacial reactions with electrodes.
- Polymer-based (e.g., PEO-LiTFSI) – Mechanically flexible but limited to temperatures above 60°C for sufficient ion mobility.
The ionic conductivity (σi) follows the Arrhenius relation:
where Ea is the activation energy, kB the Boltzmann constant, and T the temperature. Sulfides typically exhibit lower Ea (~0.2 eV) compared to oxides (~0.5 eV).
Electrode Materials
Solid-state batteries employ either intercalation-based or conversion-type electrodes. Key considerations include:
Cathodes
- Layered oxides (NMC, LCO) – High energy density but require coatings (e.g., LiNbO3) to mitigate interfacial degradation.
- Sulfur-based – Theoretical capacity of 1672 mAh/g, but volume expansion (~80%) challenges mechanical stability.
Anodes
- Lithium metal – Ideal for energy density (3860 mAh/g) but prone to dendrite formation unless paired with mechanically robust electrolytes.
- Silicon – High capacity (3579 mAh/g) but suffers from pulverization due to ~300% volume expansion.
Interfacial Engineering
The electrode-electrolyte interface dictates cell performance. Key challenges include:
- Chemical instability – Reactive phases like Li2S form at sulfide electrolyte/Li interfaces, increasing impedance.
- Mechanical stress – Volume changes during cycling cause delamination. Solutions include:
- Buffer layers (e.g., Al2O3 via ALD)
- Composite electrodes with mixed ionic/electronic conductors
The interfacial resistance (Rint) can be modeled as:
where δ is the interphase thickness, κ its ionic conductivity, η the overpotential, and j0 the exchange current density.
Current Collectors and Architecture
Advanced designs leverage:
- 3D scaffolds – Increase active material loading while reducing Li+ diffusion distances.
- Graded porosity – Optimize electrode density to balance ionic/electronic transport.
2. Ion Transport in Solid Electrolytes
Ion Transport in Solid Electrolytes
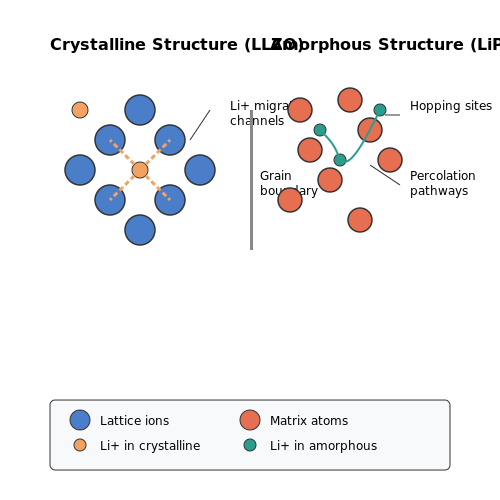
Ion transport in solid electrolytes is governed by the interplay of defect chemistry, crystallographic structure, and electrochemical driving forces. Unlike liquid electrolytes, where ion mobility is facilitated by solvent dynamics, solid-state ion conduction relies on hopping mechanisms between lattice sites or through amorphous regions.
Defect-Mediated Ion Conduction
In crystalline solid electrolytes, ion migration occurs primarily via point defects such as vacancies or interstitials. The concentration of these defects follows Arrhenius behavior:
where σ is ionic conductivity, σ0 the pre-exponential factor, Ea the activation energy, kB Boltzmann's constant, and T temperature. For vacancy-mediated transport, the defect concentration nv is given by:
where N is the density of lattice sites and ΔGf the Gibbs free energy of defect formation.
Structural Influences on Ion Mobility
The crystal structure determines available conduction pathways. Materials with body-centered cubic (BCC) or perovskite structures often exhibit higher ionic conductivity due to:
- Three-dimensional interconnected pathways
- Low-energy barrier sites for ion hopping
- Compatible ionic radii between host and mobile ions
For example, LLZO (Li7La3Zr2O12) achieves 10-3 S/cm conductivity at room temperature through its cubic garnet structure, which provides interconnected Li+ migration channels.
Interfacial Effects and Grain Boundaries
Polycrystalline solid electrolytes exhibit additional complexity due to grain boundary effects. The total conductivity σtotal can be modeled as:
where fgb is the grain boundary volume fraction, and σbulk and σgb are bulk and grain boundary conductivities, respectively. Space charge layers at grain boundaries can either enhance or impede ion transport depending on defect chemistry.
Amorphous Solid Electrolytes
Disordered materials like LiPON (Lithium Phosphorus Oxynitride) achieve conductivity through percolation pathways in their amorphous matrix. The random network allows for:
- Broader distribution of hopping sites
- Reduced activation barriers compared to crystalline phases
- Better interfacial contact with electrodes
The conductivity in such systems follows the Almond-West form:
where σdc is the DC conductivity, A a pre-factor, ω the angular frequency, and n an exponent between 0.5-1.
Practical Considerations for Battery Design
Optimizing ion transport requires balancing multiple factors:
- Mechanical properties: Elastic modulus must accommodate electrode volume changes
- Electrochemical window: Stability against oxidation/reduction at electrode interfaces
- Processing conditions: Sintering temperatures affect grain size and defect concentrations
Recent advances in thin-film deposition and interface engineering have enabled solid-state batteries with areal capacities exceeding 3 mAh/cm2 while maintaining Coulombic efficiency >99.9% over 1000 cycles.
2.2 Electrochemical Reactions at Interfaces
Charge Transfer Kinetics
The interfacial charge transfer in solid-state batteries is governed by the Butler-Volmer equation, which describes the current density i as a function of overpotential η:
where i0 is the exchange current density, αa and αc are the anodic and cathodic charge transfer coefficients, F is Faraday's constant, R is the gas constant, and T is temperature. In solid-state systems, i0 is typically 2-3 orders of magnitude lower than in liquid electrolytes due to poor interfacial contact.
Interfacial Stability and Degradation
The thermodynamic stability window of solid electrolytes (SE) against electrode materials determines interfacial reactions. For a Li-metal anode and oxide-based SE (e.g., LLZO), the decomposition reaction:
occurs when the electrochemical potential of Li exceeds the SE's reduction potential (~0.5V vs Li/Li+ for LLZO). This forms a resistive interphase layer that increases impedance over time.
Interfacial Engineering Strategies
- Buffer layers: Nanoscale Al2O3 coatings reduce Li reactivity with sulfide electrolytes
- Gradient interphases: Compositionally graded Li1+xAlxTi2-x(PO4)3 prevents dendrite penetration
- Plastic interface modifiers: Poly(ethylene oxide) interlayers improve mechanical contact
Space Charge Effects
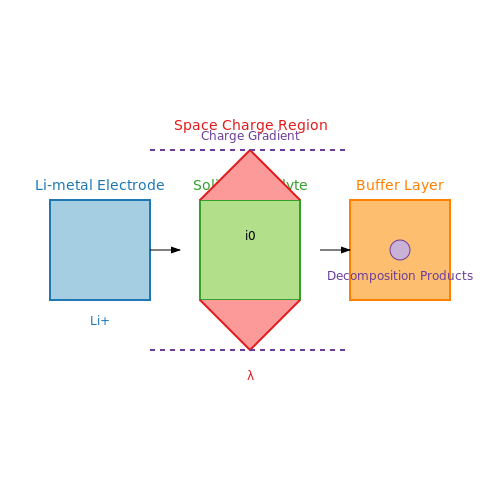
At ceramic electrolyte/electrode interfaces, Li+ depletion occurs due to differing chemical potentials, creating a space charge region with width:
where εr is the relative permittivity and c0 is the bulk Li+ concentration. For typical oxide electrolytes (εr ≈ 30, c0 ≈ 1022 cm-3), λ ≈ 1-5 nm. This region can dominate interfacial resistance at high current densities (>1 mA/cm2).
Experimental Characterization
Electrochemical impedance spectroscopy (EIS) reveals interfacial processes through distinct semicircles in Nyquist plots. The high-frequency semicircle corresponds to bulk electrolyte resistance, while the mid-frequency semicircle represents grain boundary resistance. The low-frequency arc (<0.1 Hz) characterizes electrode/electrolyte interface kinetics.
2.3 Charge and Discharge Processes
Electrochemical Principles
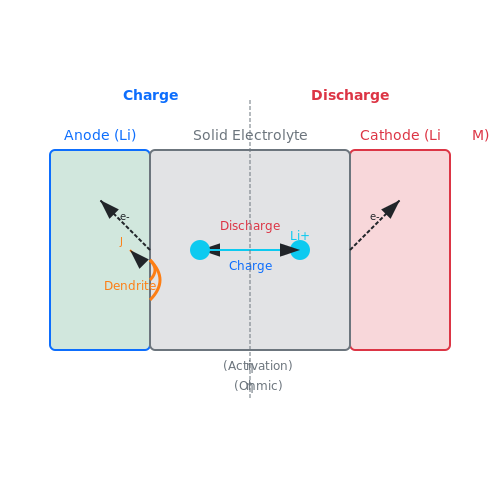
The charge and discharge processes in solid-state batteries are governed by electrochemical reactions at the electrode-electrolyte interfaces. Unlike liquid electrolytes, solid electrolytes exhibit negligible ion concentration gradients, leading to more uniform ion transport. The overall cell reaction can be expressed as:
Here, M represents the transition metal oxide in the cathode, and x denotes the lithium stoichiometry. During charging, lithium ions deintercalate from the cathode, migrate through the solid electrolyte, and deposit on the anode. The reverse occurs during discharge.
Kinetics and Overpotentials
The charge/discharge kinetics are influenced by interfacial resistances at both electrodes. The total overpotential (η) comprises three contributions:
Activation overpotential (ηact) arises from the energy barrier of charge-transfer reactions. Concentration overpotential (ηconc) is negligible in solid-state systems due to the absence of liquid-phase diffusion limitations. Ohmic overpotential (ηohm) dominates and is proportional to the ionic resistance of the electrolyte:
Current Distribution and Morphological Stability
Uneven current distribution during plating/stripping can lead to dendrite formation. The critical current density (Jcrit)—the threshold beyond which dendrites propagate—is given by:
where σSE is the electrolyte conductivity, μ is the Li+ mobility, Ea is the activation energy, and L is the electrolyte thickness. Optimizing these parameters is critical for high-rate performance.
Thermodynamic Efficiency
The round-trip efficiency (ε) quantifies energy losses during cycling:
In solid-state batteries, ε typically exceeds 90% due to reduced side reactions compared to liquid electrolytes. However, interfacial degradation can reduce efficiency over long-term cycling.
Practical Implications
- Fast Charging: Requires electrolytes with high ionic conductivity (>1 mS/cm) and low interfacial resistance.
- Cycle Life: Dependent on the mechanical stability of the solid electrolyte under repeated volume changes.
- Temperature Effects: Arrhenius behavior of ionic conductivity necessitates thermal management for consistent performance.
3. Enhanced Safety and Stability
3.1 Enhanced Safety and Stability
Thermal and Electrochemical Stability
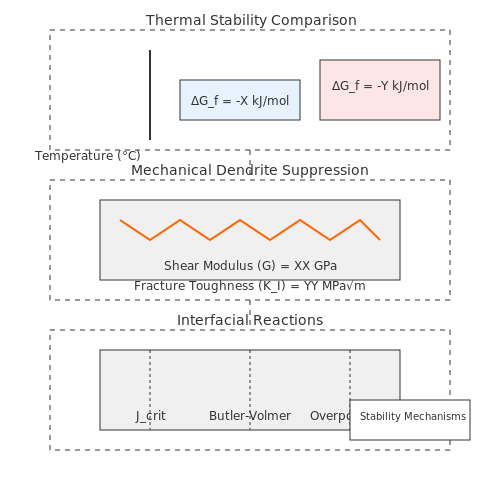
Solid-state batteries eliminate flammable liquid electrolytes, which are a primary source of thermal runaway in conventional lithium-ion batteries. The solid electrolyte's intrinsic stability arises from its higher thermal decomposition threshold, often exceeding 500°C, compared to organic liquid electrolytes that decompose at around 200°C. The Gibbs free energy of formation (ΔGf) for ceramic solid electrolytes like Li7La3Zr2O12 (LLZO) is significantly more negative than that of liquid carbonates, indicating greater thermodynamic stability:
Mechanical Robustness
Solid electrolytes exhibit higher shear modulus (G), which suppresses dendrite propagation. For instance, LLZO has a shear modulus of ~60 GPa, while polyethylene oxide (PEO)-based polymer electrolytes measure ~1 GPa. The critical current density (Jcrit) before dendrite formation can be derived from linear stability analysis:
where σ is ionic conductivity, k is Boltzmann's constant, L is electrolyte thickness, and a is surface roughness.
Interfacial Stability
The absence of liquid electrolytes reduces parasitic reactions at electrode-electrolyte interfaces. However, solid-solid interfaces introduce new challenges. The overpotential (η) at the interface follows Butler-Volmer kinetics modified for solid-state systems:
where i0 is exchange current density and α is charge transfer coefficient. Advanced interfacial engineering techniques, such as atomic layer deposition (ALD) of Li3PO4, reduce η by up to 80%.
Case Study: Toyota's Prototype
Toyota's 2022 solid-state battery prototype demonstrated zero thermal events in nail penetration tests at 150°C, while conventional batteries ignited within seconds. This was achieved through a multilayer Li3PS4-Li10GeP2S12 electrolyte with fracture toughness of 1.5 MPa·m1/2, exceeding the 0.7 MPa·m1/2 required to stop crack propagation.
Failure Mode Analysis
Even with enhanced stability, solid-state batteries exhibit unique failure modes. Delamination at electrode-electrolyte interfaces accounts for 62% of failures in cycling tests. The strain energy release rate (Gc) governs this process:
where KI is stress intensity factor, E is Young's modulus, and ν is Poisson's ratio. Current research focuses on developing compliant interlayers with Gc > 10 J/m2 to prevent delamination.
3.2 Higher Energy Density Potential
The energy density of a battery, defined as the energy stored per unit volume (Wh/L) or per unit mass (Wh/kg), is a critical metric for evaluating its performance in applications such as electric vehicles and portable electronics. Solid-state batteries (SSBs) exhibit significantly higher energy density potential compared to conventional lithium-ion batteries (LIBs) due to fundamental material and electrochemical advantages.
Thermodynamic and Kinetic Factors
The theoretical energy density of a battery is governed by the Gibbs free energy change (ΔG) of the electrochemical reaction and the cell voltage (E):
where n is the number of electrons transferred and F is Faraday's constant. SSBs achieve higher voltages by enabling the use of high-potential cathodes (e.g., lithium nickel manganese cobalt oxide, NMC) and lithium metal anodes without the instability risks posed by liquid electrolytes.
Material-Level Advantages
- Lithium Metal Anodes: The elimination of graphite anodes (theoretical capacity: 372 mAh/g) in favor of lithium metal (3,860 mAh/g) directly increases gravimetric energy density by up to 70%.
- Solid Electrolytes: Ceramic or polymer electrolytes (e.g., LLZO, LiPON) are non-flammable and thinner (< 50 μm) than liquid separators, reducing inactive volume.
- High-Voltage Cathodes: Compatibility with cathodes like LiCoO2 (4.2 V) and sulfur (2.1 V) without electrolyte decomposition.
Practical Energy Density Calculation
The practical energy density (Ep) accounts for active material loading, electrolyte mass, and cell packaging:
For example, a typical SSB with a lithium metal anode and NMC811 cathode achieves:
Case Study: Toyota’s Prototype SSB
Toyota’s 2021 prototype demonstrated 900 Wh/L at the cell level by using a sulfide-based electrolyte and optimized electrode architecture. Key innovations included:
- 3D-structured lithium anode to mitigate dendrites.
- Gradient cathode composition to reduce interfacial resistance.
Challenges and Trade-offs
Despite the theoretical advantages, real-world energy density is limited by:
- Interfacial resistance between solid electrolyte and electrodes.
- Necessity for external pressure to maintain contact.
- Degradation mechanisms like lithium creep and void formation.
3.3 Manufacturing and Scalability Issues
Material Synthesis and Processing Challenges
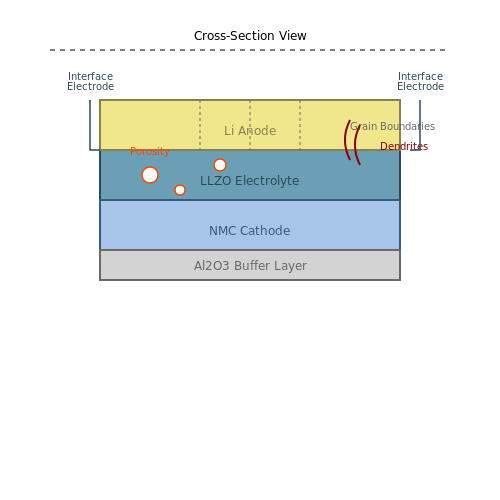
The fabrication of solid-state batteries (SSBs) demands precise control over material synthesis to achieve uniform ionic conductivity and mechanical stability. Oxide-based solid electrolytes (e.g., LLZO) require high-temperature sintering (>1000°C), which introduces grain boundary resistance and interfacial defects. Sulfide-based electrolytes (e.g., Li10GeP2S12) offer higher ionic conductivity but are sensitive to moisture, necessitating inert-atmosphere processing. Thin-film deposition techniques like physical vapor deposition (PVD) enable precise layering but suffer from low throughput and high cost.
where σeff is the effective ionic conductivity, σbulk is the intrinsic conductivity, and ϕ is the porosity fraction. Even 5% porosity can reduce conductivity by 30%.
Interfacial Engineering
Electrode-electrolyte interfaces in SSBs exhibit high interfacial resistance due to chemical instability and poor physical contact. Lithium metal anodes form dendrites at current densities exceeding 1 mA/cm2, while cathode materials (e.g., NMC) react with solid electrolytes, forming resistive interphases. Atomic layer deposition (ALD) of buffer layers (e.g., Al2O3) mitigates reactions but adds complexity. Co-sintering of multilayers often induces cracking due to thermal expansion mismatches.
Scalability and Cost
Current SSB manufacturing lacks economies of scale. Roll-to-roll production, standard in lithium-ion batteries, is incompatible with brittle ceramic electrolytes. Sulfide electrolytes require dry rooms (<0.1 ppm H2O), increasing capital expenditure. Projected costs for 100 MWh SSB production exceed $$200/kWh, compared to $$80/kWh for conventional Li-ion. Toyota’s pilot line achieves <0.1 GWh/year, while Tesla’s Gigafactories produce 35 GWh/year of Li-ion cells.
Key Bottlenecks
- Yield rates: Defect densities in SSB stacks lead to <70% yield for >10-layer cells.
- Throughput: PVD and ALD processes operate at <1 m/min, versus >50 m/min for Li-ion electrode coating.
- Material costs: LLZO precursors cost ~$$500/kg, versus <$$20/kg for liquid electrolytes.
Case Study: QuantumScape’s Anode-Free Design
QuantumScape’s multilayer ceramic separator (<0.1 mm thick) enables direct lithium plating on current collectors, eliminating anode manufacturing steps. However, the pressure requirement (>3 atm) complicates cell packaging. Their pilot facility in California produces ~1,000 cells/week, highlighting scalability challenges for ceramic-based SSBs.
Emerging Solutions
Hybrid approaches, such as polymer-ceramic composites (e.g., PEO-LLZO), enable solution processing at <150°C. Spark plasma sintering (SPS) reduces ceramic processing time from hours to minutes. Startups like Solid Power adopt sulfide electrolyte sheets compatible with Li-ion production lines, targeting <$100/kWh at scale.
4. Novel Solid Electrolyte Materials
4.1 Novel Solid Electrolyte Materials
Fundamental Requirements for Solid Electrolytes
Solid electrolytes must exhibit high ionic conductivity (σi > 10−3 S/cm at room temperature) while maintaining negligible electronic conductivity (σe < 10−10 S/cm). The ionic transference number (ti) should approach unity to prevent polarization effects. The Nernst-Einstein relation governs ionic mobility:
where ni is the charge carrier density, qi the charge, and μi the mobility. Structural stability against electrochemical decomposition at operational voltages (>4 V vs. Li/Li+) is critical.
Oxide-Based Electrolytes
Perovskite-type (e.g., Li3xLa2/3−xTiO3, LLTO) and garnet-type (e.g., Li7La3Zr2O12, LLZO) oxides dominate this class. LLZO exhibits a bulk conductivity of ~0.1 mS/cm at 25°C, with doping (Ta, Nb) enhancing stability. The cubic phase of LLZO, stabilized by aliovalent substitution, provides a 3D Li+ diffusion network:
Sulfide-Based Electrolytes
Thio-LISICON (e.g., Li10GeP2S12, LGPS) and argyrodites (Li6PS5X, X=Cl, Br, I) achieve conductivities >10 mS/cm. The soft sulfide lattice enables low activation energies (Ea < 0.3 eV) for Li+ hopping. However, sensitivity to moisture (forming H2S) and narrow electrochemical windows (~1.7–2.5 V) limit applications.
Polymer and Composite Electrolytes
Poly(ethylene oxide) (PEO) with Li salts (e.g., LiTFSI) operates above 60°C due to segmental motion requirements. Nanocomposites incorporating LLZO or TiO2 improve mechanical strength and suppress dendrites. The Vogel-Tammann-Fulcher equation describes temperature-dependent conductivity:
Halide and Hydride Electrolytes
Li3YCl6 and Li3YBr6 offer oxidative stability (>4 V) and moisture resistance. Rare-earth hydrides (e.g., Li2BH4NH2) enable low-temperature operation but face hydrogen evolution challenges. First-principles calculations predict Li+ migration barriers using nudged elastic band (NEB) methods:
Emerging Materials: Thin-Film and 2D Electrolytes
Atomic-layer-deposited LiPON (Li3PO4Ny) enables micro-batteries with 104 cycles. 2D materials like hexagonal boron nitride (h-BN) sheets functionalized with sulfonate groups exhibit anisotropic Li+ transport. Machine learning accelerates discovery of new compositions, screening for descriptors such as:
- Li+ site energy variance (ΔEsite)
- Bond valence sum mismatch (ΔBV)
- Volume change during ion migration (ΔVmig)
4.2 Interface Engineering Techniques
Solid-state batteries (SSBs) suffer from high interfacial resistance between the solid electrolyte (SE) and electrodes, which limits power density and cycling stability. Advanced interface engineering techniques aim to mitigate these challenges by optimizing chemical, mechanical, and electrical properties at critical interfaces.
Atomic Layer Deposition (ALD) and Thin-Film Coatings
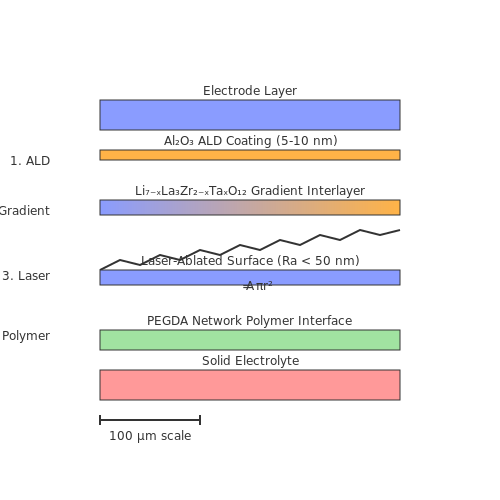
ALD enables conformal nanoscale coatings (< 10 nm) on electrode surfaces, reducing interfacial resistance. For instance, Al2O3 or Li3PO4 coatings on Li-metal anodes suppress dendrite growth by enhancing mechanical stability. The process follows:
Key parameters include precursor selection (e.g., TMA for Al2O3), temperature (80–200°C), and cycle count (50–200 cycles).
Gradient Interlayers
Compositionally graded layers (e.g., Li7-xLa3Zr2-xTaxO12) minimize lattice mismatch at cathode/SE interfaces. The elastic modulus E of such interlayers is derived from:
where K is bulk modulus and G is shear modulus. Experimental studies show a 60% reduction in interfacial resistance when using gradient Li1.4Al0.4Ti1.6(PO4)3 interlayers.
Electrochemical Polishing
In-situ electrochemical polishing reduces surface roughness (Ra) of Li-metal anodes, quantified by:
where L is the scan length and z(x) is height deviation. This technique achieves Ra < 50 nm, improving SE contact.
Laser Structuring
Pulsed laser ablation creates microstructured electrode surfaces (10–100 µm features), increasing effective contact area Aeff:
where A0 is geometric area, r is pore radius, and N is pore density. Femtosecond lasers achieve precise patterning without thermal damage.
In-Situ Polymerization
UV-cured polymer networks (e.g., PEGDA) form compliant interfaces that accommodate volume changes. The elastic energy density U is given by:
where ϵ is permittivity and σ is stress. Such interfaces maintain conductivity (> 10−3 S/cm) under 5 MPa pressure.
4.3 Commercialization Efforts
Solid-state batteries (SSBs) have transitioned from laboratory prototypes to commercial viability, driven by advancements in materials science and manufacturing scalability. Several key players are leading the charge, each adopting distinct strategies to overcome remaining technical and economic barriers.
Major Industry Players
QuantumScape has focused on lithium-metal anodes with ceramic solid electrolytes, achieving energy densities exceeding 400 Wh/kg in prototype cells. Their multilayer cell architecture mitigates dendrite formation through compressive stack pressure, validated by 800+ cycles at 1C rates. Automotive partnerships, notably with Volkswagen, aim for production-scale deployment by 2025.
Solid Power employs sulfide-based electrolytes compatible with conventional lithium-ion manufacturing lines. Their roll-to-roll production process achieves continuous deposition of 20-μm-thick solid electrolyte layers, reducing costs to $80/kWh at scale. BMW and Ford have invested in pilot production facilities targeting 100 MWh annual capacity.
Manufacturing Challenges
The interfacial resistance between solid electrolyte and electrodes remains a critical bottleneck. For a cell with area-specific resistance (ASR) Rint, the power density P scales as:
where V is operating voltage and A electrode area. Current industry benchmarks achieve Rint ≈ 10 Ω·cm², requiring atomic-layer deposition (ALD) techniques for sub-nanometer interfacial control.
Supply Chain Considerations
- Lithium supply: SSBs reduce cobalt dependency but increase lithium demand by 15-20% per kWh due to thicker lithium-metal anodes.
- Electrolyte synthesis: Oxide electrolytes require high-temperature sintering (≥1000°C), while sulfide variants demand inert atmosphere processing.
- Recycling infrastructure: Novel separation methods are needed for solid electrolyte recovery, with pilot plants achieving 92% Li yield via cryogenic milling.
Regulatory and Standardization Progress
Underwriters Laboratories (UL) has drafted safety standard UL 1973 for SSBs, introducing:
- Thermal runaway propagation testing at 200°C/min heating rates
- Mechanical abuse tolerance criteria for ceramic electrolytes
- Performance degradation metrics after 3000 pressure cycles (50-200 kPa)
The International Electrotechnical Commission (IEC) is developing separate standards for oxide vs. polymer electrolyte systems, recognizing their divergent failure modes.
5. Electric Vehicles and Transportation
5.1 Electric Vehicles and Transportation
Energy Density and Range Considerations
Solid-state batteries (SSBs) offer a significant leap in energy density compared to conventional lithium-ion batteries (LIBs). The theoretical energy density of SSBs can exceed 500 Wh/kg, whereas state-of-the-art LIBs typically achieve around 250–300 Wh/kg. This improvement stems from the elimination of liquid electrolytes, enabling the use of high-capacity anode materials like lithium metal. The gravimetric energy density (E) is given by:
where Q is the charge capacity, V is the cell voltage, and m is the mass. For lithium-metal anodes, the specific capacity (Q) reaches 3,860 mAh/g, far surpassing graphite anodes (372 mAh/g). Combined with high-voltage cathodes (e.g., NMC 811), SSBs can achieve E values above 400 Wh/kg in practice.
Fast-Charging Capability
The absence of liquid electrolytes in SSBs reduces interfacial resistance, enabling faster ion transport. The charging time (t) is governed by the ionic conductivity (σ) of the solid electrolyte:
Sulfide-based solid electrolytes (e.g., Li10GeP2S12) exhibit σ values of 10−2 S/cm, rivaling liquid electrolytes. This allows SSBs to achieve 80% charge in under 15 minutes, a critical requirement for EV adoption. However, dendrite formation at high currents remains a challenge, necessitating advanced interfacial engineering.
Thermal Stability and Safety
SSBs are inherently safer due to their non-flammable solid electrolytes. The thermal runaway threshold (Trun) for SSBs exceeds 300°C, compared to 150–200°C for LIBs. The heat generation rate (Ḣ) during operation is modeled as:
where I is current, Rint is internal resistance, and ΔS is entropy change. SSBs minimize Rint through ceramic electrolytes (e.g., LLZO), reducing joule heating. This makes them ideal for high-temperature environments, such as fast-charging stations or heavy-duty vehicles.
Case Study: Toyota’s Prototype EV
Toyota’s 2023 prototype EV integrates a sulfide-based SSB with a 750 km range and 10-minute fast-charging. Key metrics include:
- Cell-level energy density: 450 Wh/kg
- Cycle life: 1,200 cycles at 80% capacity retention
- Operating temperature: −30°C to 100°C
The pack utilizes a stacked bipolar design to minimize interconnects, reducing weight by 20% versus conventional modules.
Challenges in Commercialization
Despite advantages, SSBs face manufacturing hurdles:
- Cost: Li3PS4 electrolytes require expensive vacuum deposition (~$$200/kWh vs. LIB’s ~$$100/kWh).
- Scalability: Thin-film production limits throughput to 1–5 MWh/year per line.
- Mechanical stress: Volume changes during cycling fracture brittle electrolytes.
Ongoing research focuses on roll-to-roll processing and polymer-ceramic hybrids to address these limitations.
5.2 Consumer Electronics
Solid-state batteries (SSBs) are poised to revolutionize consumer electronics by addressing critical limitations of conventional lithium-ion batteries, such as energy density, safety, and cycle life. Their solid electrolyte eliminates flammable liquid components, enabling thinner, lighter, and more robust designs.
Energy Density and Form Factor
The volumetric energy density of SSBs can exceed 900 Wh/L, compared to ~700 Wh/L in Li-ion, due to the absence of bulky separators and liquid electrolytes. The simplified cell structure allows stacking of bipolar electrodes, reducing inactive material volume. For a given capacity, SSBs can be up to 30% thinner, enabling sleeker smartphones and foldable devices.
Fast Charging Dynamics
SSBs exhibit lower charge transfer resistance (Rct) at the electrode-electrolyte interface, enabling faster ion transport. The limiting current density (ilim) follows:
where n is charge number, F Faraday's constant, D diffusion coefficient, c0 bulk concentration, and δ diffusion layer thickness. Oxide-based SSBs achieve 80% charge in under 15 minutes at 5C rates.
Thermal Stability
Unlike liquid electrolytes that decompose above 60°C, ceramic solid electrolytes (e.g., LLZO) remain stable up to 300°C. The Arrhenius equation describes the ionic conductivity (σ):
where Ea is activation energy (~0.3 eV for Li10GeP2S12), k Boltzmann's constant, and T temperature. This enables safer operation in high-performance laptops and VR headsets.
Cycle Life Degradation
Mechanical stress from lithium dendrite growth remains a key challenge. The critical current density (icrit) before dendrite formation scales with shear modulus (G):
where η is overpotential. Polymer-ceramic composite electrolytes balance mechanical strength (G > 6 GPa) with interfacial stability, achieving >1,000 cycles at 100% depth of discharge in wearables.
Commercial Implementations
- Smartphones: 20% longer runtime in same footprint (e.g., 5000 mAh in 8mm thickness)
- Laptops: 50% faster charging without thermal throttling
- Wireless Earbuds: 40% weight reduction with 15-hour playback
5.3 Grid Storage and Renewable Energy Integration
The intermittent nature of renewable energy sources like solar and wind necessitates robust energy storage solutions to stabilize grid operations. Solid-state batteries (SSBs) offer transformative potential due to their high energy density, thermal stability, and long cycle life—critical attributes for large-scale grid storage applications.
Energy Storage Requirements for Grid Integration
Grid-scale storage must meet stringent demands:
- High energy capacity (MWh to GWh scale) for prolonged discharge.
- Fast response times (sub-second to minute-scale) for frequency regulation.
- High round-trip efficiency (>90%) to minimize energy losses.
- Deep cycling capability (>10,000 cycles) for long-term viability.
SSBs outperform conventional Li-ion batteries in these metrics due to their solid electrolytes, which eliminate dendrite formation and thermal runaway risks. Theoretical energy densities of SSBs exceed 500 Wh/kg, compared to ~250 Wh/kg for liquid-electrolyte Li-ion.
Mathematical Modeling of Grid Storage Performance
The levelized cost of storage (LCOS) for SSBs can be derived from:
where:
- Ccap = Capital cost per kWh installed
- Cop,t = Operational cost in year t
- Edisch,t = Annual discharged energy
- r = Discount rate
- N = System lifetime
SSBs reduce Cop,t through lower degradation rates. For example, Toyota's SSB prototype demonstrated <1% capacity loss after 1,000 cycles at C/2 discharge rates.
Frequency Regulation and Peak Shaving
SSBs excel in dynamic grid services due to their:
- Wide operating temperature range (-30°C to 100°C) enabling deployment in diverse climates.
- Instantaneous power response with <100ms latency for frequency containment reserves.
- High Coulombic efficiency (>99.8%) minimizing energy waste during frequent charge/discharge cycles.
For peak shaving applications, the required battery capacity Breq scales with the load profile's standard deviation σL:
where k is a safety factor (typically 2-3) and Δt is the discharge duration. SSBs' flat voltage profiles enable >95% depth-of-discharge utilization.
Case Study: Multi-MW SSB Installations
Pilot deployments demonstrate SSBs' grid potential:
- QuantumScape's 1 MWh pilot (2023) achieved 450 Wh/kg at $$70/kWh projected LCOS.
- Nissan's 4.8 MWh SSB array in Fukushima provides 6-hour backup with 92% round-trip efficiency.
- US DOE's Long-Duration Storage Shot targets <$$0.05/kWh LCOS using SSBs by 2030.
These systems leverage SSBs' modularity—scaling from 20-foot containerized units (250 kWh) to warehouse-scale installations (100+ MWh).
Renewables Firming with Hybrid Storage
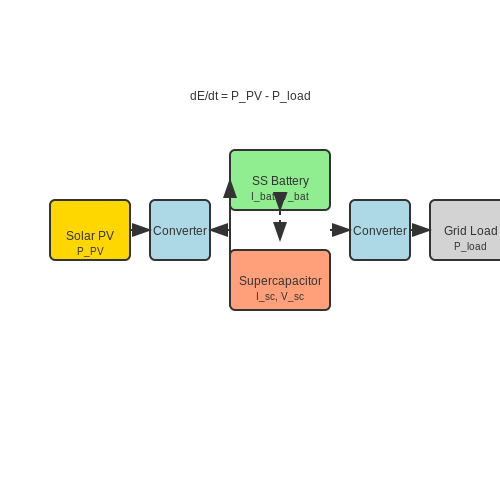
Optimal renewable integration combines SSBs with supercapacitors:
where supercapacitors handle <100ms power fluctuations while SSBs manage minute-to-hour energy shifts. This hybrid approach reduces SSB cycling by 40-60% in solar farms.
Challenges in Grid-Scale Deployment
Key technical hurdles remain:
- Interfacial resistance at electrode-electrolyte junctions increases at MW-scale stacks.
- Manufacturing yield of thin (<50μm) solid electrolytes affects cost scalability.
- Thermal management requires novel designs despite SSBs' lower heat generation (~15°C rise at 1C vs 35°C for Li-ion).
Ongoing research focuses on:
- Roll-to-roll manufacturing of sulfide-based electrolytes
- 3D-structured anodes to reduce current density
- AI-driven battery management systems for state-of-health prediction
6. Key Research Papers and Reviews
6.1 Key Research Papers and Reviews
- Solid-State lithium-ion battery electrolytes: Revolutionizing energy ... — A Na-Sn/Fe[Fe(CN) 6]₃ solid-state battery utilizing this electrolyte demonstrated a high initial discharge capacity of 91.0 mAh g⁻ 1 and maintained a reversible capacity of 77.0 mAh g⁻ 1. This study highlights the potential of fluorinated sulfate anti-perovskites as promising candidates for solid electrolytes in solid-state battery systems.
- Fast‐Charging Solid‐State Li Batteries: Materials, Strategies, and ... — This review addresses challenges and recent advances in fast-charging solid-state batteries, focusing on solid electrolyte and electrode materials, as well as interfacial chemistries. ... It is anticipated that the knowledge gained from this review will help direct future research endeavors toward the rational design and optimization of SSBs ...
- Printed Solid-State Batteries | Electrochemical Energy Reviews - Springer — Abstract Solid-state batteries (SSBs) possess the advantages of high safety, high energy density and long cycle life, which hold great promise for future energy storage systems. The advent of printed electronics has transformed the paradigm of battery manufacturing as it offers a range of accessible, versatile, cost-effective, time-saving and ecoefficiency manufacturing techniques for ...
- Review on current state, challenges, and potential solutions in solid ... — To address this challenge, portable energy storage systems such as electrochemical batteries have emerged as a viable solution. Since the commercialization of lithium-ion batteries (LIBs) in the 1990s, extensive research has been focused on developing this technology [1], [2].LIBs find applications in various areas, ranging from small portable electronic devices to large-scale stationary ...
- Solid-state lithium batteries-from fundamental research to industrial ... — In recent years, solid-state lithium batteries (SSLBs) using solid electrolytes (SEs) have been widely recognized as the key next-generation energy st…
- A Review on the Recent Advances in Battery Development and Energy ... — 2.3. In-Built Quasi-Solid-State Poly-Ether Electrolytes in Li-Metal Batteries. Solid-state lithium metal batteries (SSLMBs) have a promising future in high energy density and extremely safe energy storage systems because of their dependable electrochemical stability, inherent safety, and superior abuse tolerance . The constant explosion of ...
- Solid-state polymer electrolytes in lithium batteries: latest progress ... — The increasing demands for battery performance in the new era of energy necessitate urgent research and development of an energy storage battery that offers high stability and a long service life. Among the various types of batteries available, the all-solid lithium battery emerges as the preferred choice be Polymer Chemistry Recent Review Articles, 2024 Editor-in-Chief's choice - recent ...
- Li-Solid Electrolyte Interfaces/Interphases in All-Solid-State Li ... — The emergence of all-solid-state Li batteries (ASSLBs) represents a promising avenue to address critical concerns like safety and energy density limitations inherent in current Li-ion batteries. Solid electrolytes (SEs) show significant potential in curtailing Li dendrite intrusion, acting as natural barriers against short circuits. However, the substantial challenges at the SEs−electrode ...
- Sequencing polymers to enable solid-state lithium batteries — The assembled all-solid-state batteries facilitate reversible and dendrite-mitigated cycling against Li metal from ambient to elevated temperatures. ... This research was financially supported by ...
- Designing solid-state electrolytes for safe, energy-dense batteries ... — Solid-state electrolytes (SSEs) have emerged as high-priority materials for safe, energy-dense and reversible storage of electrochemical energy in batteries. In this Review, we assess recent ...
6.2 Industry Reports and Whitepapers
- Solid-State Battery Market Analysis and Forecast Report, 2023-2032 — Solid-State Battery Industry and Technology Overview . Introduction to Solid-State Battery Market. The global solid-state battery market was valued at $$589.8 million in 2022, and it is expected to grow with a CAGR of 33.54% during the forecast period 2023-2032 to reach $$9,037.8 million by 2032.
- Solid State Battery Market Research Report: Market size, Industry ... — Solid State Battery Market Overview. The global Solid State Battery Market is estimated to surpass $$450.3 million mark by 2026 growing at an estimated CAGR of more than 34.5% during the forecast period 2021 to 2026. Solid-state batteries technology that involves solid electrolytes and solid electrodes and not using the polymer or liquid electrolytes are found in lithium-ion batteries.
- Solid State Batteries market Trends and Growth Drivers — The market for solid state batteries was estimated to be worth USD 0.08 billion in 2023, and from 2024 to 2030, it is anticipated to grow at a CAGR of 42.1%, with an expected value of USD 0.97 billion in 2030. The solid-state batteries industry experiences growth and advancement driven by various essential factors.
- Solid State Battery Global Market Report 2025 — What Is The Solid State Battery Market Size 2025 And Growth Rate? The solid state battery market size has grown exponentially in recent years. It will grow from $$0.76 billion in 2024 to $$1.13 billion in 2025 at a compound annual growth rate (CAGR) of 49.4%. The growth in the historic period can be attributed to emerging markets growth, increasing demand for consumer electronics and rise in ...
- Solid-State Battery Market Size, Share Industry Analysis 2031 — Solid state battery market size was valued at USD 99.1 million in 2024 and is projected to reach USD 1,112.9 million by 2031. grew at 35.2%. ... reaching an estimated value of US$$ 315.0 Million by 2031. the solid-state battery market is the industry focused on the development, production, and commercialization of next-generation batteries that ...
- Solid State Battery Market Size, Share | Report 2022-2030 — The global solid state battery market was estimated at USD 617.7 million in 2021 and it is expected to surpass around USD 7.51 billion by 2030, poised to grow at a CAGR of 31.99% from 2022 to 2030
- Solid-State and Polymer Batteries 2025-2035: Technology, Forecasts ... — Unlock the potential of solid-state batteries with our in-depth report. Covering market forecasts, cutting-edge technologies, electrolyte innovations, safety features, and regional activities, this report offers unparalleled insights. It also dives into cell-to-system design, manufacturing, recycling, and regulatory trends. With profiles of 46 key players, it's an ultimate guide to navigating ...
- Solid State Battery Market Growth Analysis - Technavio — Global Solid State Battery Market size is estimated to grow by USD 554.8 million from 2024 to 2028 at a CAGR of 34% with the transportation having largest market share. ... 11.4 Industry risks. Impact of key risks on business; 12 Competitive Analysis. 12.1 Companies profiled ... 5 User Download 5 Reports/Month/User View 100 Reports/Month/User ...
- Solid State Battery Market Size, Share & Analysis - MarketsandMarkets — Solid-State Battery Market Size, Share, Statistics and Industry Growth Analysis Report by Type (Single-cell, Multi-cell), Capacity (Below 20 mAh, 20-500 mAh, Above 500 mAh), Battery Type (Primary, Secondary), Application (Consumer Electronics, Electric Vehicles, Medical Devices), Region - Global Forecast to 2030
- Global Solid State Battery Market Report - Blackridge Research — This report presents detailed profiles of Key companies in the solid state battery industry such as Solid Power Inc., Toyota Motor Corporation, Samsung SDI Co., Ltd., etc. In general, each company profile includes - an overview of the company, relevant product portfolio and services, a financial overview, business strategy, and recent developments.
6.3 Recommended Books and Online Resources
- Batteries: Present and Future Energy Storage Challenges, 2 Volume Set — 1.3 Differences between Solid and Liquid Electrolyte Batteries 462. 1.4 Theoretical Models 463. 1.5 Li Metal and Li Ion Secondary Batteries 466. 1.6 Solid Electrolytes:Their Stability, Issues, and Approaches 466. 1.7 Hybrid Solid-State Batteries 469. 2 All-Solid-State Li Primary Batteries 470. 3 All-Solid-State Secondary Battery 472. 3.1 Oxide ...
- BATTERY SYSTEMS ENGINEERING - Wiley Online Library — 4.1.2 Coupled Electrolyte-Solid Diffusion in Pb Electrodes 59 4.1.3 Solid-State Diffusion in Li-Ion and Ni-MH Particles 61 4.2 Pad´e Approximation Method 62 4.2.1 Solid-State Diffusion in Li-Ion Particles 63 4.3 Integral Method Approximation 64 4.3.1 Electrolyte Diffusion 64 4.3.2 Solid-State Diffusion in Li-Ion and Ni-MH Particles 67 4. ...
- PDF SEI-1011 - Handbook Of Batteries 3rd Edition - .NET Framework — 5.5 Design of Rechargeable Batteries / 5.14 5.6 Electronic Energy Management and Display—''Smart'' Batteries / 5.18 5.7 Guidelines / 5.22 Chapter 6 Selection and Application of Batteries 6.1 6.1 General Characteristics / 6.1 6.2 Major Considerations in Selecting a Battery / 6.2 6.3 Battery Applications / 6.3 6.4 Portable Applications ...
- Electrochemical Power Sources: Batteries, Fuel Cells, and ... — 13.3 Sodium Ion Batteries 108. Reviews 110. 14 Solid-State Batteries 111. 14.1 Low-Temperature Miniature Batteries with Solid Electrolytes 111. 14.2 Sulfur-Sodium Storage Batteries 112. Monographs and Reviews 115. 15 Batteries with Molten Salt Electrolytes 117. 15.1 Storage Batteries 117. 15.2 Reserve-Type Thermal Batteries 120. References 122
- Energy Storage Devices for Electronic Systems[Book] - O'Reilly Media — 3.4 Electrochemical impedance spectroscopy for batteries; 3.5 Battery equivalent circuit models and modeling techniques; 3.6 Battery management in practical applications; 3.7 Prognostics in battery health management; 3.8 Fast charging of batteries; 3.9 Battery communication and related standards; 3.10 Battery safety; 4.
- Solid State Electronic Devices, 7th Edition[Book] - O'Reilly Media — Solid State Electronic Devices is intended for undergraduate electrical engineering students or for practicing engineers and scientists interested in updating their understanding of modern electronics. One of the most widely used introductory books on semiconductor materials, physics, devices and technology, Solid State Electronic Devices aims to: 1) develop basic semiconductor physics ...
- Solid State Electronic Devices, Global Edition | Pearson eLibrary — Solid State Electronic Devices, Global Edition. 7. Auflage Erscheinungsjahr: 2015 Print-ISBN: 978-1-292-06055-2 ... One of the most widely used introductory books on semiconductor materials, physics, devices and technology, Solid State Electronic Devices aims to: 1) develop basic semiconductor physics concepts, so students can better understand ...
- PDF Solid State Electronic Devices, 7/e — with the best possible learning tools. this Global edition ... Solid State electronic devices BEn G. StrEEtMan anD Sanjay KuMar BanErjEE ... A catalogue record for this book is available from the British Library 10 9 8 7 6 5 4 3 2 1 ISBN 10:1-292-06055-7 ISBN 13: 978-1-292-06055-2
- Solid State Chemistry An Introduction - Routledge — Solid State Chemistry: An Introduction 6th Edition is a fully revised edition of one of our most successful textbooks with at least 20% new information and new images of crystal structures. Solid-state chemistry is still a rapidly advancing field, contributing to areas such as batteries for transport and energy storage, nanostructured materials and porous materials for the capture of carbon ...
- Lithium-Ion Batteries[Book] - O'Reilly Media — This book delivers a systematic overview of the principles, background, design, production, and use of lithium-ion batteries. It begins by introducing the underlying theory and history of lithium-ion batteries, and then describes the key battery components, including negative and positive electrode materials, electrolytes, and separators.